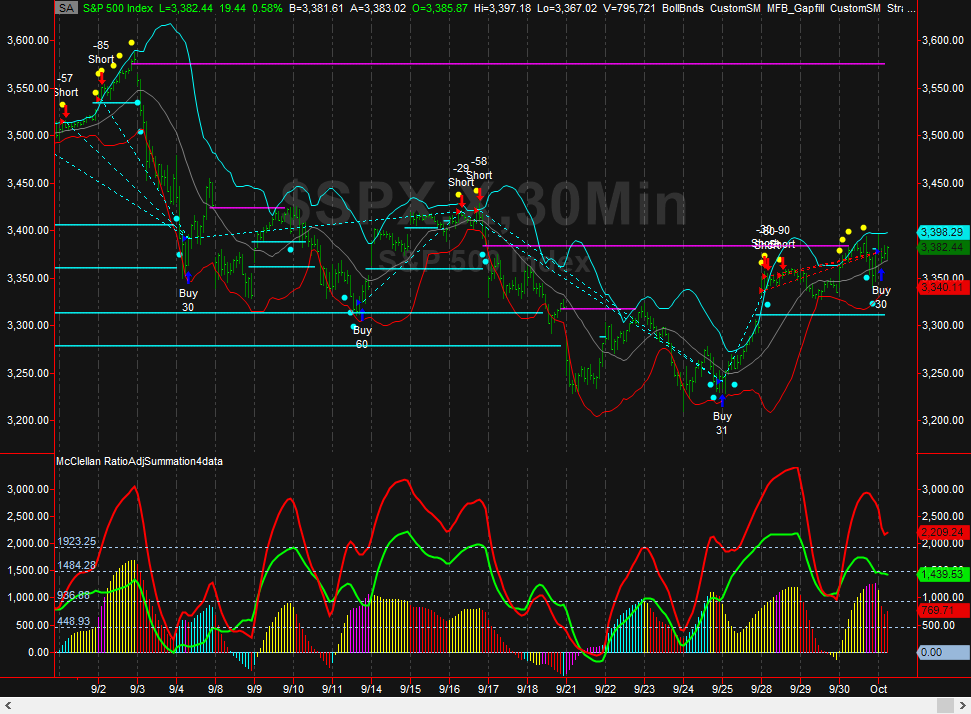
*Update on this, the ST model covered 10 ET 10/1/20. The model is now long, see chart below. This is not surprising because the short trades are about 50% profitable vs near 100% profitable for long trades.
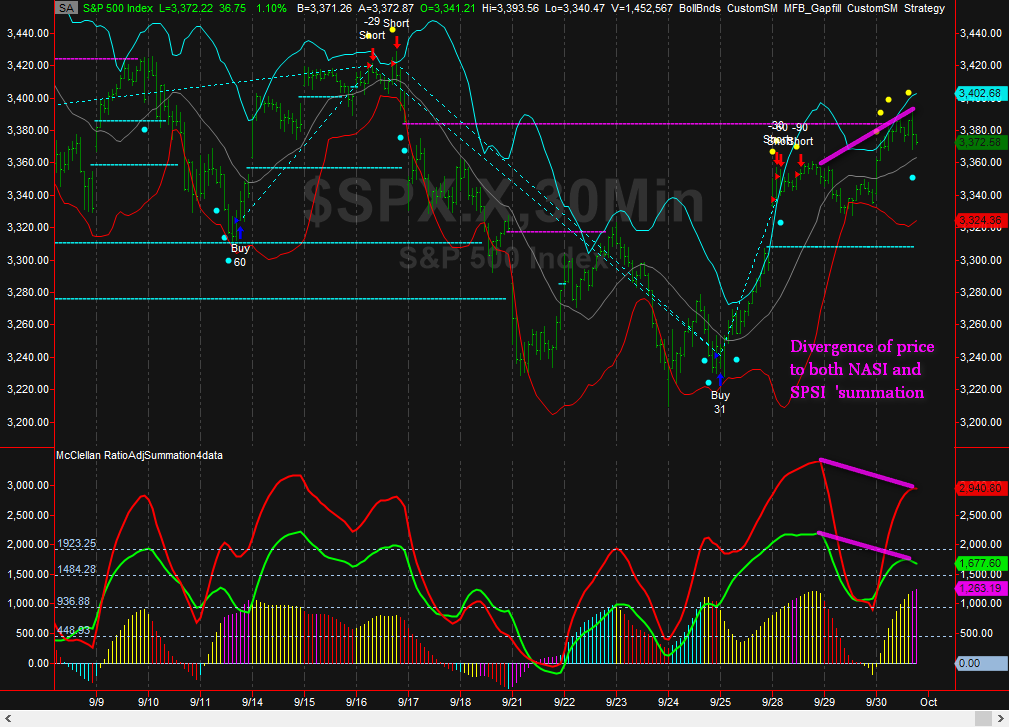
The sell off that began at 14:25 ET 9/30/20 showed that the bears are not giving up as the bulls are taking profit at today's R2 of 3393 (from pivot analysis). One way to see this is the divergence that was forming around 14:00 ET (magenta diagonal lines). Both SPSI SP 500 summation index and NASI showed this divergence. The NASI (green plot lower panel) is again lagging the SPSI. This may resolve itself with the gap up from over the weekend (9/28) at SPX 3308 being filled. Too early to tell where the bottom or reversal will rest.
updated 11:30 AM ET 10/1/2020