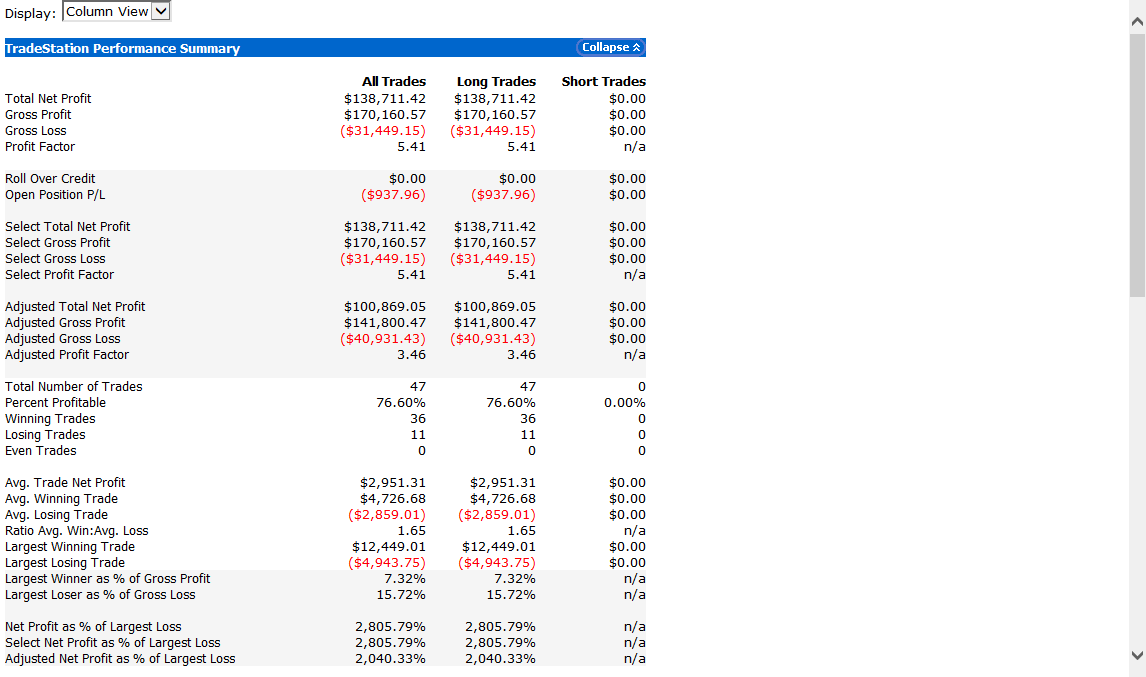
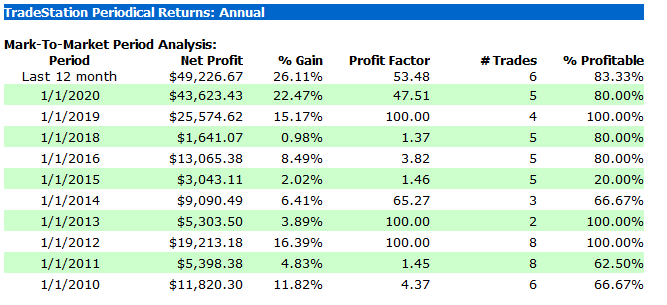
*see more correction below with updated returns with 76.6% profitable trades, 7.3% max drawdown
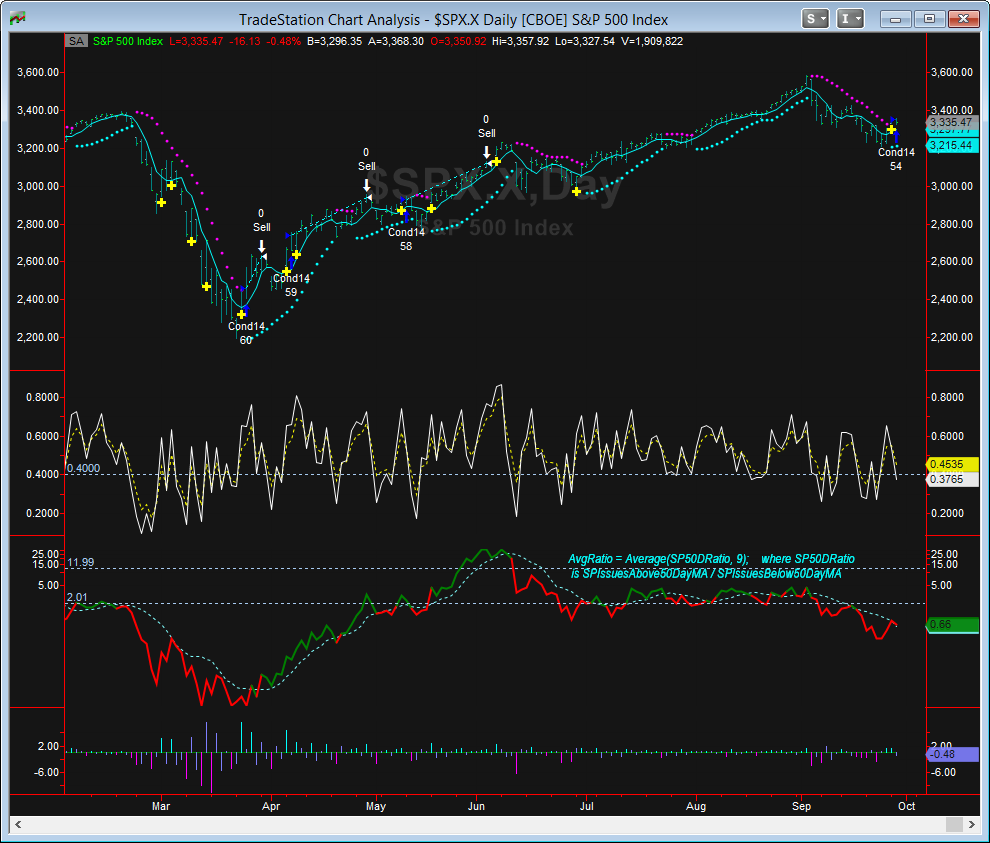
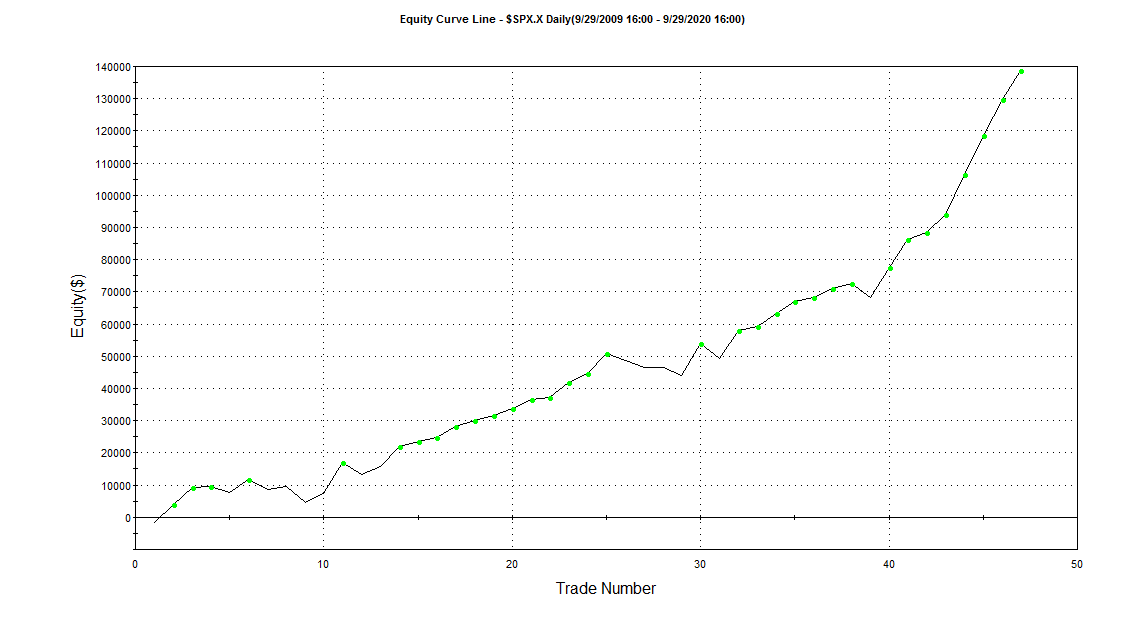
The mildly bullish trend following yesterday’s thrust begs the question ‘What is the likelihood of a profitable long position following a 9/28/20 like breadth thrust?’ Well, the following strategy analysis using 11 years of data says there was a 68% chance of profitable trades out of 44 trades in the last 11 years, total time in the market was 2 years 3 months with average days in the winning trades as 17 days, average days in losing trade was 8 days. There is a trailing stop on these trades to prevent large losses. The Sharpe ratio is about 1.5, 6.4% annual return and the equity curve looks encouraging for the bulls. The trade has been triggered this AM 9/29/20 when it briefly traded above yesterday’s close.
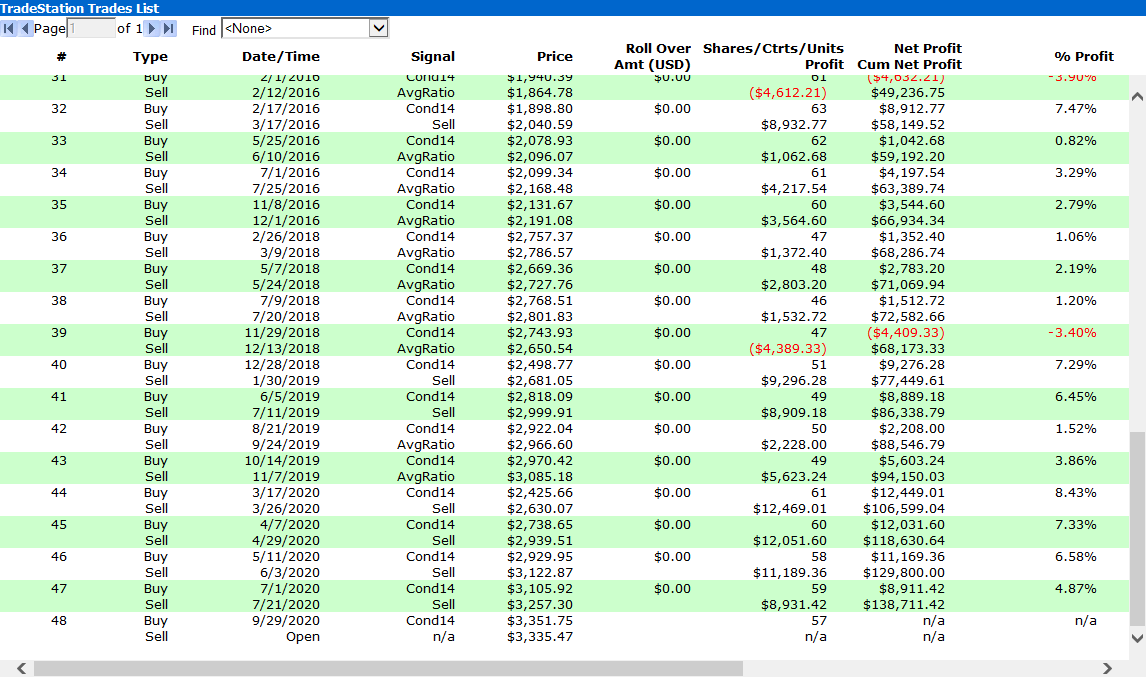
More information about the trades may be useful. Some of you may be wondering why some of the yellow crosses indicating breadth thrusts were not executed. One reason is the way the trades are set up where additional market breadth data from the S&P issues above 50 day MA and S&P issues above 50 day MA precluded those trades from taking place. The other reason is the way the buy next bar (daily chart) at this bar's close price with the stop criterion. If the next bar's price has fallen too much and not recovered, the stop entry price could never be triggered.
A simple adjustment to the exit and entry using market breadth data improved the strategy to a Sharpe ratio of 1.8, 8% annual return and 76.6% profitable trades. 25% of the time in the market. Average bars in winning trade of 17 days, average bars in losing trades 11.