
In a data-driven world, companies are under pressure to extract clear, actionable insights from the massive amounts of information they collect every day. Yet many executives still struggle with a basic—but crucial—question:
What is the difference between Business Intelligence (BI) and Data Analytics?
And more importantly, which one does your organization actually need?
While the two fields are closely connected and often overlap, they serve different strategic purposes. BI helps businesses understand what has happened and how to optimize ongoing operations, while Data Analytics digs deeper to uncover why it happened, what will happen next, and what you should do about it.
Today, we’ll break down both disciplines in clear terms, compare them side by side, explore their real-world applications, and help you determine the right approach for your business. We’ll also highlight how a team like Zoolatech, specializing in BI and data analytics consulting services, can help you move forward with confidence.
Table of Contents
-
What Is Business Intelligence (BI)?
-
What Is Data Analytics?
-
Key Differences Between BI and Data Analytics
-
BI vs. Data Analytics: Comparison Table
-
When You Need BI
-
When You Need Data Analytics
-
When You Need Both
-
How Zoolatech Helps Companies Leverage BI and Data Analytics
-
Final Thoughts
1. What Is Business Intelligence (BI)?
Business Intelligence (BI) is the practice of collecting, organizing, and visualizing historical and real-time business data to support better decision-making. Think of BI as the process that transforms raw data into easy-to-understand insights that help you monitor performance and identify opportunities for optimization.
The Primary Goal of BI
To answer: “What is happening in the business right now?”
And sometimes: “What has happened in the past, and how is it trending?”
BI is focused on reporting, dashboards, KPIs, and operational insights. This helps leaders and teams quickly understand the health of the business and act accordingly.
Typical BI Capabilities
-
Data dashboards for real-time visibility
-
Automated reporting across departments
-
Historical trend analysis
-
Operational monitoring (sales, logistics, marketing, finance)
-
KPI tracking aligned with business objectives
-
Data visualization for fast interpretation
Examples of BI Tools
-
Tableau
-
Power BI
-
Looker
-
Qlik
-
Sisense
BI tools make data more accessible to non-technical stakeholders by turning it into interactive charts, scorecards, and dashboards.
2. What Is Data Analytics?
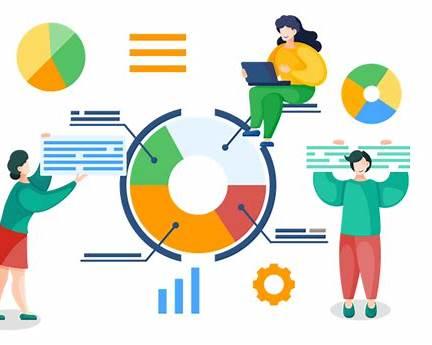
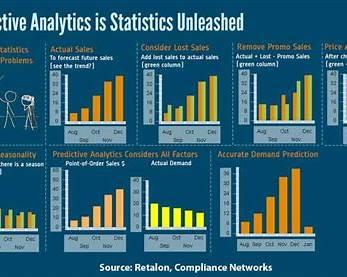
Data Analytics goes beyond BI by analyzing data to uncover patterns, test hypotheses, make predictions, and recommend actions.
The Primary Goal of Data Analytics
To answer deeper questions such as:
-
“Why did this happen?”
-
“What will happen next?”
-
“What should we do to achieve our goals?”
It is a broader, more advanced discipline that often involves:
-
Statistical modeling
-
Machine learning
-
Predictive analytics
-
Data mining
-
Experimentation & A/B testing
-
AI-driven insights
Data Analytics is ideal for companies that want more than dashboards—they want strategic insights and forward-looking intelligence.
Types of Data Analytics
-
Descriptive Analytics
What happened? (similar to BI) -
Diagnostic Analytics
Why did it happen? -
Predictive Analytics
What is likely to happen next? -
Prescriptive Analytics
What actions should we take for the best outcome?
While BI focuses on reporting the present and past, Data Analytics helps forecast the future.
3. Key Differences Between BI and Data Analytics
Although both functions use data, their roles differ significantly in scope, complexity, and business impact.
1. Purpose
-
BI: Monitor and report on business performance.
-
Data Analytics: Discover insights, make predictions, and improve decision-making.
2. Timeframe
-
BI: Looks backward and at the present.
-
Data Analytics: Focuses on the future.
3. Questions Answered
-
BI: “What is happening?”
-
Analytics: “Why is it happening?” “What’s next?”
4. Complexity
-
BI: Easier for non-technical teams, highly visual.
-
Analytics: Requires advanced technical and statistical skills.
5. Users
-
BI: Business leaders, department heads, operations teams.
-
Analytics: Data analysts, data scientists, technical teams.
6. Outcome
-
BI: Insights and reports.
-
Analytics: Models, predictions, recommendations.
7. Tools & Technologies
-
BI: Visual dashboards and reporting tools.
-
Analytics: Machine learning frameworks, Python/R, big data engines.
4. BI vs. Data Analytics: Comparison Table
| Feature / Focus | Business Intelligence (BI) | Data Analytics |
|---|---|---|
| Main Purpose | Track performance | Discover insights & predict future |
| Primary Questions | What happened? What’s happening now? | Why did it happen? What will happen next? |
| Timeframe | Past & present | Future-oriented |
| Complexity Level | Moderate | High |
| Typical Users | Executives, managers, operations | Analysts, scientists, strategists |
| Tech Stack | BI dashboards & reporting | Statistical modeling, ML, big data platforms |
| Outcomes | KPIs, dashboards, reports | Predictions, insights, recommendations |
| Business Maturity Fit | Small to large companies | Mid-size to enterprise |
| Data Requirements | Clean, structured data | Large, diverse datasets |
5. When You Need Business Intelligence
You should prioritize BI if your organization needs:
1. Clear Visibility Into Current Performance
Sales dashboards, marketing KPIs, financial performance—BI helps you monitor these in real time.
2. Data Uniformity Across Teams
BI aligns your teams around shared metrics and a single source of truth.
3. Faster Decision-Making
BI provides intuitive dashboards so leaders can act quickly without digging through spreadsheets.
4. Performance Optimization
If you want to identify bottlenecks, inefficiencies, or opportunities for improvement, BI is indispensable.
5. Structured Data Environment
If your data is already stored neatly in databases, CRMs, or ERPs, BI leverages it efficiently.
BI is best for companies looking to optimize day-to-day operations and improve clarity.
6. When You Need Data Analytics
You should prioritize Data Analytics if your organization wants to:
1. Predict Customer Behavior
Predictive models can forecast churn, lifetime value, buying probability, or conversion likelihood.
2. Understand Root Causes
Analytics reveals why sales dropped, why customer satisfaction changed, or why supply delays occur.
3. Personalize Customer Experiences
Machine learning models support recommendation engines and personalized marketing.
4. Optimize Strategy Through Data
Analytics helps validate product-market fit, pricing strategies, and marketing campaigns.
5. Work With Complex, Large-Scale Data
Unstructured data, large datasets, multi-source data—analytics thrives in these environments.
6. Build AI Capabilities
Machine learning, automated decisioning, and intelligent systems rely heavily on analytics.
Data Analytics is ideal for companies that want to innovate, automate, and make smarter strategic decisions.
7. When You Need Both BI and Data Analytics
Most modern companies ultimately need both, because BI and analytics complement each other.
Use BI to:
-
Monitor performance
-
Build dashboards
-
Track KPIs
-
Automate reporting
Use Data Analytics to:
-
Investigate anomalies
-
Predict outcomes
-
Optimize strategy
-
Build ML and AI capabilities
Together, they create a full-cycle data ecosystem that empowers both operational and strategic decision-making.
8. How Zoolatech Helps Companies Leverage BI and Data Analytics
Zoolatech is a technology partner that helps organizations build scalable, efficient, and future-ready data ecosystems. Their team works with companies across industries to develop solutions that turn raw data into business value.
Zoolatech Delivers End-to-End Business Intelligence Solutions
-
Designing intuitive dashboards
-
Implementing enterprise-wide KPI systems
-
Integrating data sources into unified reporting
-
Creating custom BI automation
-
Setting up real-time monitoring and alerting
With clean and consistent BI infrastructure, organizations can operate with confidence—knowing they have accurate information at their fingertips.
Zoolatech Also Specializes in Advanced Data Analytics
For companies ready to go beyond dashboards, Zoolatech provides data analytics consulting services, including:
-
Predictive analytics modeling
-
Customer analytics & segmentation
-
Machine learning solutions
-
Recommendation system development
-
Statistical analysis & hypothesis testing
-
Data engineering and scalable architecture
Their approach is collaborative, strategic, and tailored to each client’s needs.
Why Companies Choose Zoolatech
-
Deep technical expertise
-
Industry experience across retail, fintech, logistics, and SaaS
-
Team of senior data engineers, BI developers, and data scientists
-
Ability to build custom, high-performance platforms
-
Focus on measurable business outcomes
Whether you're building your first BI dashboard or scaling a full enterprise analytics platform, Zoolatech helps you move faster and smarter.
9. Final Thoughts: Which Do You Need?
If your primary goal is to understand and optimize what’s already happening in your business, Business Intelligence is the right starting point.
If you want to uncover deeper insights, explore opportunities, forecast trends, and automate decision-making, you need Data Analytics.
But in today’s competitive landscape, the most successful companies use both. BI ensures visibility and stability, while analytics drives innovation and growth.
And with a technology partner like Zoolatech, you can build a data strategy that meets your needs today while preparing your organization for the future.