
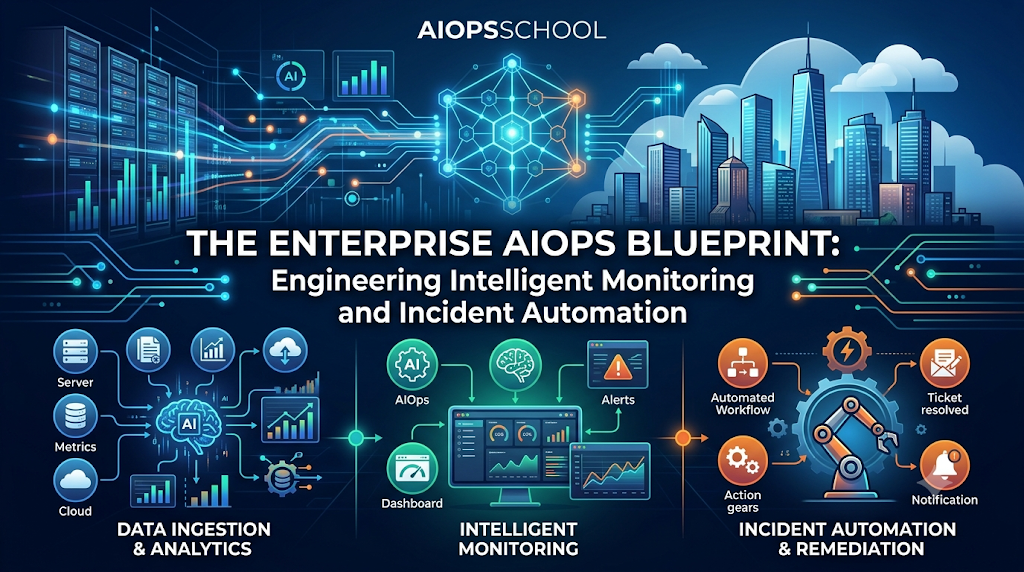
Introduction
Managing corporate IT infrastructure used to be a problem of scale that fit cleanly inside a single server room. Operations teams monitored resources using basic threshold scripts and manually inspected local logs when an outage occurred. If an application service slowed down, a simple memory or disk space check usually revealed the source of the trouble.
Today, cloud-native infrastructure has fundamentally broken that manual approach. Modern enterprise platforms run across hundreds of distributed microservices, ephemeral container deployments, and highly complex hybrid-cloud environments. A single user interaction triggers a cascading sequence of network requests across an array of independent database instances, authentication APIs, and third-party payment gateways.
When a failure occurs within this tangled web of dependencies, components rarely fail in isolation. Instead, a single foundational problem can cause dozens of connected applications to emit error signals simultaneously. On-call engineering teams are instantly hit with an overwhelming wave of digital noise across alert channels and monitoring tools, causing severe alert fatigue. To navigate this scale crisis, technology organizations are adopting Artificial Intelligence for IT Operations (AIOps) to replace manual debugging workflows with intelligent, data-driven automation.
What is AIOps? Ingesting Data Science into Infrastructure
AIOps describes the systematic application of machine learning, big data, and advanced analytics to automate and improve IT operations. Instead of relying on static, human-configured thresholds, AIOps platforms analyze real-time streams of operational data to identify patterns, detect anomalies, and predict potential system degradations.
In a traditional setup, engineering teams spend significant time reacting to failures after they impact end users. AIOps shifts the operational model toward proactive management. The platform continuously ingests performance metrics, application logs, system traces, and change event data to understand the standard operating baseline of the environment.
AIOps acts as an automated analytics layer rather than a replacement for human engineering. It filters out background noise, provides deep structural context during incidents, and enables Site Reliability Engineering (SRE) and DevOps teams to make fast, data-driven decisions during critical production outages.
The Operational Shift: Monitoring vs. Observability vs. AIOps
Understanding how AIOps impacts modern engineering requires clarifying the differences between monitoring, observability, and AI operations. These concepts build upon one another to create a comprehensive operational strategy.
Traditional Infrastructure Monitoring
Monitoring focuses on tracking component state. It relies on fixed uptime checks and hardware counters to tell you when a specific resource is broken. It is inherently reactive, notifying you after a system asset has breached a predefined parameter limit.
Modern Observability
Observability uses internal system indicators—specifically metrics, logs, and distributed traces (the MELT framework)—to deduce why a system behaves a certain way. By using open instrumentation frameworks like OpenTelemetry, engineers can trace user requests as they move across distributed microservices. However, observability still requires human intervention to manually write queries, search through data lakes, and isolate bugs during an incident.
The AIOps Ecosystem
AIOps introduces mathematical modeling and machine learning to your observability telemetry. It acts as an automated, cognitive layer that constantly reviews incoming data streams. AIOps handles the heavy lifting of data analysis: it builds dynamic performance baselines, filters out duplicate alerts, groups related events across different infrastructure layers, determines the root cause, and initiates automated scripts to fix issues before they impact customers.
Paradigm Comparison Matrix
| Core Property | Traditional Monitoring | Modern Observability | AIOps Architectures |
| Operational Stance | Reactive / Fragmented | Diagnostic / Manual | Proactive / Autonomous |
| Primary Inputs | Server metrics, Uptime values | Metrics, Logs, Traces (MELT) | Telemetry + Topology + Change Logs |
| Alert Trigger Logic | Predefined static boundaries | Query-driven discoveries | Algorithmic anomaly detection |
| Root Cause Discovery | Manual cross-team triage | SRE code and log inspection | Automated topology graph mapping |
| Scale Suitability | Stable, monolithic environments | Distributed cloud systems | Hyper-scale, ephemeral setups |
The Core Architectural Components of AIOps Platforms
A production-grade AIOps platform uses a multi-layered data architecture designed to process massive datasets in real time without causing system lag or application dependencies.
+-------------------------------------------------------------+
| 1. TELEMETRY COLLECTION LAYER                              |
| Ingests raw Metrics, Logs, Traces via OpenTelemetry & eBPF |
+-------------------------------------------------------------+
                               │
                               ▼
+-------------------------------------------------------------+
| 2. DATA PROCESSING & NOISE REDUCTION                        |
| Normalizes incoming data structures and discards duplicate alerts |
+-------------------------------------------------------------+
                               │
                               ▼
+-------------------------------------------------------------+
| 3. COGNITIVE ENGINE (Machine Learning Layer)                 |
| Dynamic Baselining | Event Correlation | Root Cause Mapping |
+-------------------------------------------------------------+
                               │
                               ▼
+-------------------------------------------------------------+
| 4. ORCHESTRATION & AUTOMATION LAYER                         |
| Triggers incident tickets or executes self-healing runbooks |
+-------------------------------------------------------------+
Data Collection and Ingestion
The foundation of any AIOps architecture is a clean ingestion pipeline. Telemetry data must be harvested across every layer of the enterprise stack, including bare-metal hardware, virtual machines, cloud service APIs, database clusters, application code, and container networks. Utilizing open telemetry collectors allows the platform to ingest this data without creating dependency lock-in with a single vendor.
Normalization and Streaming Analytics
Because operational data arrives in a mix of formats—such as unstructured text logs, time-series metrics, and structured JSON files—the platform uses streaming pipelines to standardize the data. During this phase, filtering models scrub out duplicate log files and repetitive system notifications, preventing raw noise from cloud-native environments from overwhelming downstream data storage.
The Orchestration Interface
Once the machine learning algorithms process the incoming streams, the results are pushed to an orchestration layer. For high-priority anomalies requiring human judgment, the system enriches the incident description with relevant tracing data and routes it to tools like PagerDuty or Slack. For well-documented issues, the interface passes structured commands to automation platforms to repair the problem instantly.
Intelligent Incident Management: Event Correlation and Root Cause Analysis
The core technical advantage of an AIOps implementation lies in its ability to handle multi-layered alert storms through automated mathematical modeling and event correlation.
Dynamic Baselining
Systems naturally exhibit cyclical behavior based on human habits. An enterprise application might experience predictable traffic spikes during morning startup windows while remaining mostly idle over weekends. Static alert thresholds trigger false alarms during peak hours or miss genuine failures during low-usage windows.
AIOps uses statistical models to calculate rolling historical averages and standard deviations ($\sigma$) for key system indicators. This approach ensures an alert triggers only when a metric breaks completely outside its normal historical operating envelope for that specific block of time, providing intelligent alerting.
Real-World Event Correlation and Inference
When a core infrastructure asset drops off the network, it can trigger hundreds of disconnected error logs across your upstream services. AIOps platforms use multi-dimensional algorithms to group these separate warnings into a single, cohesive incident ticket. This process relies on temporal proximity, topological dependency, and semantic similarity.
[ PostgreSQL Database ] ──► Connection Timeout (Root Cause Event)
          │
          ├──► [ Auth Service ] ──► Pod Latency (Downstream Anomaly)
          │
          └──► [ Checkout API ] ──► HTTP 504 Error (Downstream Anomaly)
Instead of flooding on-call engineers with three separate critical pages, the AIOps correlation engine evaluates the time proximity and structural dependencies between these systems. It groups the downstream application errors together as symptoms of a single incident, explicitly identifying the primary database timeout as the root cause node.
Designing Safe Auto-Remediation and Guardrails
A mature AIOps implementation does more than just group alerts—it takes automated actions to resolve known, recurring issues. However, building an automated self-healing framework requires strict validation controls to ensure safety in production environments.
+-----------------------------------------------------------------+
|                    AUTO-REMEDIATION WORKFLOW                    |
|                                                                 |
| [ AIOps Cognitive Engine ] ──► Detects High-Confidence Anomaly  |
|                                              │                  |
|                                              ▼ (JSON Webhook)   |
| [ Secure API Gateway ]     ──► Verifies Guardrails & Limits     |
|                                              │                  |
|                                              ▼ (Executes Patch) |
| [ Kubernetes API Server ]  ──► Launches Rolling Pod Restart    |
+-----------------------------------------------------------------+
When an anomaly is detected, the cognitive engine sends an event payload containing full infrastructure context to a secure automation gateway. Before any remediation script runs, the gateway runs the request through strict safety checks:
-
Confidence Score Boundaries: The engine's machine learning model must output a high confidence metric verifying the anomaly type before running a script.
-
Rate-Limiting Throttles: The gateway blocks an automated runbook from executing more than once within a given time frame to prevent infinite loops.
-
Human-in-the-Loop Fallbacks: If the automated fix fails to clear the anomaly within a narrow safety window, the gateway freezes the script, rolls back changes, and immediately escalates the incident to a senior engineer with a full audit log.
Enterprise Implementation Roadmap and Maturity Strategy
Successful enterprise AIOps adoption depends on high-quality telemetry, observability maturity, automation strategy, operational readiness, and continuous improvement. Because every infrastructure setup varies in complexity, organizations should evaluate their existing infrastructure and operational maturity before jumping into full-scale implementation.
Phase 1: Define Your Data Foundation
Focus entirely on cleaning up your data pipelines. Update your legacy applications to use structured logging formats and deploy unified OpenTelemetry collections across your clusters. Ensure your cloud resources are tagged with accurate metadata.
Phase 2: Deploy Baselines in Shadow Mode
Connect your AIOps analytics tools to your telemetry data streams, but do not route alerts directly to your on-call engineers. Run the machine learning models in shadow mode to evaluate how effectively they track anomalies, allowing you to tune the algorithms and eliminate false positives.
Phase 3: Activate Event Correlation
Turn off your old static alert rules and route your monitoring signals through the automated correlation engine. Track clear performance metrics, such as your Alert Volume Reduction percentage and Mean Time to Detect (MTTD), to verify the platform's reliability.
Phase 4: Launch Guardrailed Automation
Introduce automated runbooks to handle simple, low-risk infrastructure issues, such as clearing local disk caches or recycling stuck connection pools. Ensure human engineering fallback paths are always enabled.
Common Deployment Challenges and Operational Pitfalls
Ingesting Dirty Telemetry Pipelines
Machine learning engines depend entirely on clean input data. If your cloud deployment lacks consistent tags or contains fragmented distributed traces, your correlation models will fail to find accurate data patterns. Focus on building solid data collection pipelines before investing in advanced analytics.
Over-Automating Too Quickly
Deploying automated remediation scripts across core business databases without rate limiters or strict confidence score boundaries can lead to cascading failures during unexpected edge-case scenarios. Always restrict your new automation scripts to staging or non-production environments until they prove reliable over time.
Black-Box Distrust
On-call engineering teams are naturally skeptical of automated operational warnings if they cannot see the logic behind them. Choose AIOps systems that provide clear, explainable AI contexts, explicitly mapping out the telemetry patterns and structural changes that led to an alert.
The Evolution of Technical Careers: Becoming an AIOps Engineer
The shift toward data-driven infrastructure automation is redefining standard engineering roles. Traditional systems administration and basic monitoring tasks are being replaced by specialized engineering disciplines that combine system operations with data science fundamentals.
As enterprise infrastructure scales up, technical professionals often look for structured educational paths to help navigate this architectural shift. Professional development training frameworks, such as the comprehensive AIOpsSchool curriculum, provide focused learning paths that teach engineers how to deploy distributed telemetry collectors, tune unsupervised machine learning algorithms, and manage automated remediation gateways safely.
Essential Skills for Modern Infrastructure Careers
-
Advanced Telemetry Engineering: Designing and scaling open collection standards like OpenTelemetry, managing distributed tracing contexts, and using kernel-level monitoring systems like eBPF.
-
Data Pipeline Architecture: Building and managing high-throughput message streaming systems using technologies like Apache Kafka and real-time database engines.
-
Automated Runbook Orchestration: Writing precise automation workflows that interface safely with cloud platform APIs and orchestration layers like Kubernetes.
Frequently Asked Questions (FAQs)
What exactly is the difference between AIOps and traditional APM software?
Application Performance Monitoring (APM) tools focus on tracking isolated resource indicators inside application software. AIOps platforms act as an orchestration layer above your entire system, ingesting and correlating data across APMs, cloud infrastructure logs, network monitors, and CI/CD change events to provide a unified view of your environment.
Can an AIOps platform prevent production outages before they happen?
Yes. By using predictive analytics to identify slow-moving anomalies—such as a gradual memory leak or a slow drift in database write latency—the cognitive engine can flag resource exhaustion long before it impacts end-user availability.
What specific role does OpenTelemetry play in an AIOps setup?
OpenTelemetry offers a vendor-neutral framework to collect metrics, logs, and traces. This consistency provides the clean, structured telemetry that machine learning algorithms need to find patterns and calculate accurate data correlations.
How does event correlation help resolve alert fatigue for on-call engineers?
Instead of sending separate urgent notifications for every service failure caused by a single common infrastructure issue, the correlation engine groups those related anomalies into a unified incident ticket. This approach can reduce overall alert volume significantly.
Is it necessary to have a dedicated data science team to deploy AIOps?
No. Most modern AIOps tools come with pre-trained machine learning models designed specifically to understand infrastructure and application data. Your operations team can focus on connecting data pipelines and designing runbook guardrails rather than building machine learning models from scratch.
How do safety guardrails keep automated infrastructure running safely?
Safety guardrails apply programming boundaries to your runbooks. They include forcing a script to verify high model confidence scores before running, setting strict limits on how often a script can execute, and automatically handing off tasks to human engineers if an anomaly persists.
Key Takeaways
-
Data Integrity Foundations: The long-term success of an enterprise AIOps roadmap depends on maintaining clean data ingestion pipelines, mature observability practices, and strict automation guardrails.
-
Algorithmic Noise Reduction: Replacing static thresholds with historical baselines reduces false alarms while preserving clear visibility into genuine, low-signal infrastructure issues.
-
Graph-Driven Analysis: Tracking system dependencies through topological graphs helps platforms immediately separate localized root causes from cascading downstream symptoms.
-
Incremental Safety Standards: Safe automated operations require bounded runbooks protected by explicit confidence score requirements, rate limits, and clear manual escalation paths.
Conclusion
Shifting from reactive infrastructure monitoring to an autonomous, intelligent operational platform is a multi-step journey that requires careful data preparation and explicit safety boundaries. By focusing on data cleanliness, tracking baseline application behavior in shadow testing environments, and gradually introducing rule-bounded auto-remediation scripts, your organization can successfully build a highly resilient cloud platform.
Begin your long-term operations roadmap by auditing your existing data pipelines. Focus on removing isolated monitoring software and upgrading your distributed systems to export clean telemetry streams using open collection standards. Building a solid data foundation allows your engineering team to minimize alert fatigue, accelerate incident resolution, and protect production availability.