
Introduction
In the fast-paced realm of modern software engineering, teams are constantly navigating the friction between rapid innovation and rock-solid stability. To succeed, engineering leaders need more than just gut feelings; they require concrete data. The most effective framework for measuring this balance is the DORA metrics, a set of benchmarks derived from extensive research into what truly makes high-performing technology organizations tick.
By understanding these four key performance indicators, engineering teams can transition from reactive troubleshooting to proactive optimization. This article explores how to measure, understand, and improve your software delivery pipeline.
What Are DORA Metrics?
DORA metrics—a framework established by the DevOps Research and Assessment team—provide a clear, empirical look at the health of your software development lifecycle. These metrics are categorized into two vital areas: delivery throughput and system stability.
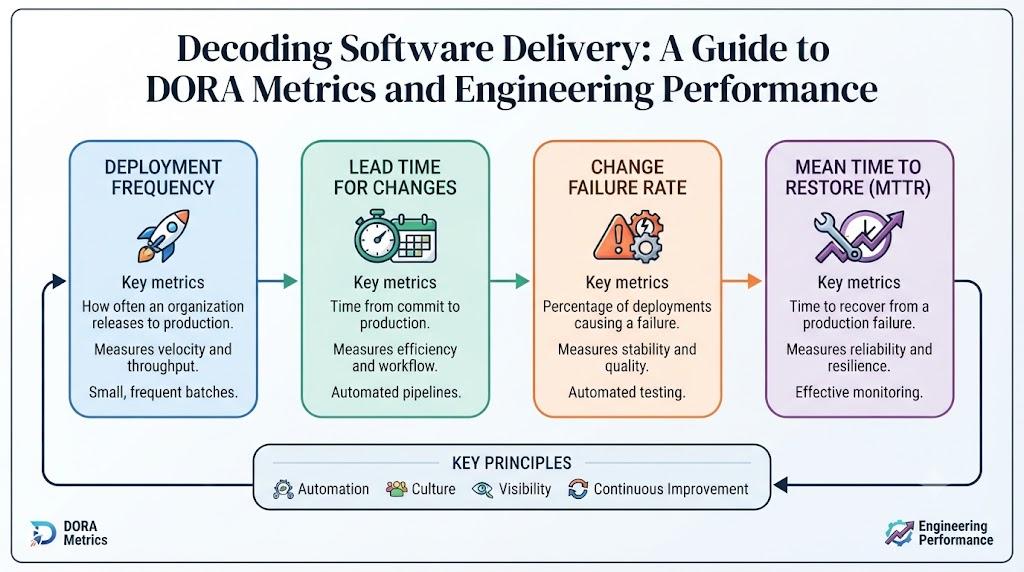
The Four Pillars
-
Deployment Frequency (DF): How often your team successfully pushes code to production. This is the primary measure of agility and pipeline efficiency.
-
Lead Time for Changes (LTTC): The duration from a code commit reaching your version control system to that same code successfully running in production. This highlights bottlenecks in your delivery process.
-
Change Failure Rate (CFR): The percentage of production deployments that result in a service disruption or require an immediate fix. This is a direct measure of release quality.
-
Mean Time to Recovery (MTTR): The average duration required to restore service after a production incident. This indicates how resilient and well-instrumented your operations are.
Why These Metrics Matter
Adopting these metrics is the hallmark of a mature engineering organization.
Business Value
For leadership, these metrics provide a window into the return on engineering investment. Improving these numbers translates to faster time-to-market and increased reliability, both of which are critical for staying competitive.
Operational Excellence
For SREs and developers, these metrics act as a diagnostic tool. A high LTTC might suggest that your testing suites are too slow or that your approval processes are too cumbersome, while a high CFR usually indicates a need for better automated testing or improved environment parity.
Professional Growth
For individual contributors, mastering these metrics allows you to advocate for better engineering practices. It shifts your focus from merely "writing code" to "delivering value reliably," which is a core skill for any senior engineer or architect.
Comparison of Performance Metrics
| Focus Category | Key Metric | Objective | Significance |
| Throughput | Deployment Frequency | Increase | Measures delivery velocity |
| Throughput | Lead Time for Changes | Decrease | Measures process efficiency |
| Stability | Change Failure Rate | Decrease | Measures output quality |
| Stability | Mean Time to Recovery | Decrease | Measures incident response |
Practical Application: Real-World Scenarios
The Agile Startup
For a startup, the priority is often speed. By aggressively shortening Lead Time for Changes, they can gain immediate user feedback. If they pair this with robust automation, they can maintain a high deployment rate without sacrificing overall stability.
The Regulated Enterprise
Large organizations often struggle with legacy bottlenecks. Here, the focus shifts to Mean Time to Recovery and Change Failure Rate. By implementing automated guardrails and infrastructure-as-code, these teams ensure that reliability is built-in, even when the release cadence is necessarily more measured.
Common Hurdles and Implementation Tips
-
Avoid the "Vanity Metric" Trap: Never use these metrics to rank developers. Doing so invites developers to "game" the data (e.g., merging unfinished code to boost frequency), which degrades overall code quality.
-
Context is King: Always interpret metrics alongside operational context. A sudden dip in performance metrics is often a sign of an external factor—such as a complex infrastructure migration—rather than a lack of developer effort.
-
Break Down Data Silos: You cannot improve what you cannot see. The biggest hurdle to implementation is often scattered data. Centralizing your logs, deployment history, and incident reports is a prerequisite for success.
Implementation Roadmap
-
Define Your Pipeline: Map out every stage from commit to production.
-
Instrument Your Tools: Connect your CI/CD, source control, and incident management platforms to a centralized dashboard.
-
Establish Baselines: Observe your team's performance for a full sprint or month before trying to optimize.
-
Target the Bottleneck: Identify the single worst-performing metric and focus your improvement efforts there.
-
Iterate: Use these metrics during every retrospective to adjust your process.
Measuring Performance with DevOpsIQ
While manual tracking is a start, enterprise-grade clarity comes from engineering intelligence. DevOpsIQ is designed to synthesize metadata from tools like GitHub, Jira, and Datadog, providing a unified view of your delivery health.
Rather than hunting for data, DevOpsIQ presents your DORA Metrics alongside your SLO (Service Level Objective) health and Error Budget consumption. Its standout feature, the Pulse Score, condenses complex operational signals into a single, intuitive indicator of service health. This tool empowers teams to replace guesswork with concrete intelligence, allowing engineering managers to make informed decisions about where to invest in automation or technical debt reduction.
Expert Recommendations for Success
-
Prioritize Small Batches: Breaking large features into smaller, incremental changes is the most effective way to improve all four DORA metrics simultaneously.
-
Invest in Observability: MTTR is only as fast as your visibility. You cannot fix what you cannot measure or see.
-
Standardize with IaC: Use tools like Terraform to eliminate "configuration drift," a leading cause of production instability.
Learning More with BestDevOps
At BestDevOps, we are dedicated to helping professionals level up their technical and strategic capabilities. Our platform offers a deep library of resources, ranging from foundational tutorials and comprehensive roadmaps to advanced discussions on SRE and platform engineering. Whether you are prepping for a technical interview or looking to optimize your organization's CI/CD strategy, our content focuses on the practical application of industry-leading best practices. We help you navigate the complexities of modern software delivery with actionable knowledge.
Frequently Asked Questions
1. Is it possible to be "too fast"?
If increasing your deployment frequency leads to a spike in your change failure rate, you have likely outpaced your automated testing capabilities. Stability must keep pace with speed.
2. Should all teams have the same targets?
No. Different services have different risk profiles. A microservice handling user profiles will have different stability requirements than a non-critical internal tool.
3. What does it mean if my MTTR is high?
It usually suggests that your team lacks sufficient observability tools or clear runbooks for incident response.
4. Can these metrics be tracked manually?
You can, but it is prone to error and rarely sustainable. Automated extraction is the preferred route for accuracy.
5. How do I convince management to focus on these?
Focus on the business outcomes: faster feature delivery, reduced downtime, and lower operational costs.
6. Does DevOpsIQ replace my current tools?
No, it complements your existing stack by aggregating data from them to provide deeper insights.
7. Are these metrics enough to measure productivity?
They measure delivery productivity, but they don't capture the creative or strategic work of software engineering. They should be used as part of a larger, balanced dashboard.
8. How often should I check the Pulse Score?
A weekly or bi-weekly check is usually sufficient to track trends and identify if a specific service needs attention.
9. Are DORA metrics just for DevOps teams?
They are for any team that cares about software quality and delivery speed, including developers and platform engineers.
10. What is the most important metric?
It depends on your current state. If you are slow, focus on Lead Time. If you are unstable, focus on Change Failure Rate and MTTR.
Final Thoughts
DORA metrics provide the objective foundation necessary to move beyond simple output measures. By consistently tracking your throughput and stability, you transform your delivery process from a "black box" into a transparent, predictable system. Success in modern software engineering is not about working harder; it is about using intelligence to remove friction, stabilize your infrastructure, and iterate with confidence. Start measuring, start iterating, and continue your path toward engineering excellence.