Translated by Gogle Translator 2023.12.02
The French Revolution 1789-1814 and climate change
Bogdan Góralski
Library of the Historical Institute of the University of Warsaw
I. Climate changes versus Earth's geoid shape changes 1
1.Introduction 1
2.General causes of changes in climate and speed of rotation of Earth 2
II. Causes of the fall of the Western Roman Empire 7
III. Modern history and changes in the location of the earth's coating 9
IV Climate change and the French Revolution 10
V. The demographic, socio-economic situation of pre-revolutionary France 15
VI. Structure of the society of pre-revolutionary France 17
VII. French revolutionary ideology 18
VIII. Food prices and the agricultural structure of feudal France 20
IX. Pre-revolutionary period and the image of feudal France 24
X. Scientific and technological revolution versus the causes of the capitalist revolution 27
Bibliography 29
Area France revolutionary was approaching towards the equator Because grew in Europe number earthquakes earth .
-
Climate changes versus Earth's geoid shape changes
This chapter is a part of my book entitled “ A modern look at the Earth's climate mechanism and the Cosmo-geophysical system of the Earth”, published online.
1.Introduction
In my previous work, I presented the concept of rotational motion of the Earth controlled by the movements of the masses of the Solar System. Changes in gravity and magnetism (?) in the Solar System cause the Earth's coating move relative to the ecliptic plane. Earth's coating consisting of earth's crust and mantle revolves by slipping over the surface of the outer, liquid , and metallic earth's nucleus.
Below I present evidence that the movement of the planets causes the movement of the earth's coating, and the precession of the earth's axis does not exist. The observer on Earth is changing its position, and star constellations are probably not moving at all.
2.General causes of changes in climate and speed of rotation of Earth.
The temperature of the interior of Earth is sustained by the constant friction between the COATING of Earth and its LIQUID OUTER CORE. The coating of Earth, consisting of the crust and the upper mantle, is rotating under the influence of the alternating gravitational field of the solar system and is rubbing against a liquid, metallic Earth's outer core, which is a spherical sliding surface for Earth's coating. The solid metallic inner core of Earth stays in the grip of the magnetic field of the Sun, which alternates according to the pulsation of gravity within the solar system. The movements of the masses inside the Earth geoid are coupled with internal interactions within the solar system, which are also subject to the influence of our galaxy.
Changes in Earth's climate (which are dependent mainly on the heating through the Sun the Earth surface) are evidence that Earth's coating moves relative to its core. Climate change resulting from the tilt of the globe in relation to the ecliptic plane causing the succession of the seasons. On top of this, there are circular movements of Earth's coating around the axis of rotation of Earth and in relation to the ecliptic plane. Movements of the coating are mirrored by the apparent changes in the position of north magnetic field (see Fig.3), which is stable in the grip of the Sun's magnetic field. Earth's coating rotates but the north magnetic field is motionless. Throughout several thousand years, the magnetic poles traveled seemingly on the moving surface of Earth along a curve surrounding the geographical pole. Deviations of the north magnetic pole from the north geographic pole reach over twenty degrees of latitude, ie . approximately 2500km and change over time (probably) regularly, i.e. determined by cyclical interactions within the solar system. The research of paleomagnetism show deviation of the northern magnetic field from the north geographic pole (the axis of rotation of Earth) mirrors the movements of Earth's coating in relation to the sun. Sometimes the movement of Earth's coating reaches this extent that magnetic poles are reversing themselves but only apparent.
Movements of Earth's coating change the moment of inertia of the Earth, which causes the variations of the speed of rotation. An increase in the speed of rotation of Earth was observed in the time when the northern magnetic pole was close to the north geographic pole, and vice versa, ie . for example, around year AD 1600 and nowadays. I believe that changes in Earth's rotation speed reflect the variability of the Earth's coating movement in relation to the center of Earth's gravity and in relation to the sun.
Deviations of the location of the northern magnetic pole NMP- from the north geographic pole over twenty degrees latitude, and the apparent circular motion of NMP around the geographic pole, mirror the movements of Earth's coating which cause regional changes in Earth's climate. The width of climatic zones designated by the seasons on Earth's surface reaches about 5 to 20 degrees latitude. Related to these zones, rainy and dry climates, which are dependent on the latitude and insolation, move along the surface of Earth, together with Earth's coating movements, which are cyclical relative to the Sun. If the coating of Earth moves about 2500 km, which is about 20 degrees latitude, climate zones shift respectively on the Earth's surface. In such a case, a given region of Earth can experience a dry season instead of the rainy season, and vice versa.
The "rising" and "sinking" zones move northward and southward together accordingly to the Earth's coating movements. Thus, the wet area near the Equator moves northward into the Northern Hemisphere in its summer, and southward into the Southern Hemisphere during its Southern summer. similarly, the dry zones and wet zone at higher latitudes shift northward and southward throughout the year.
The result of these shifting climatic zones are latitude bands with distinctive precipitation characteristics described below:
0–5° latitude: wet through the year (rising zone)
5–20° latitude: wet summer (rising zone), dry winter (sinking zone)
20–30° latitude: dry all year (sinking zone)
30–50° latitude: wet winter (rising zone), dry summer (sinking zone)
50–60° latitude: wet all year (rising zone)
60–70° latitude: wet summer (rising zone), dry winter (sinking zone)
70–90° latitude: dry all year (sinking zone)
Source of the above date:
Global Distribution of Precipitation- link:
http://www.waterencyclopedia.com/Po-Re/Precipitation-Global-Distribution-of.html#ixzz4Bj24W4Vx
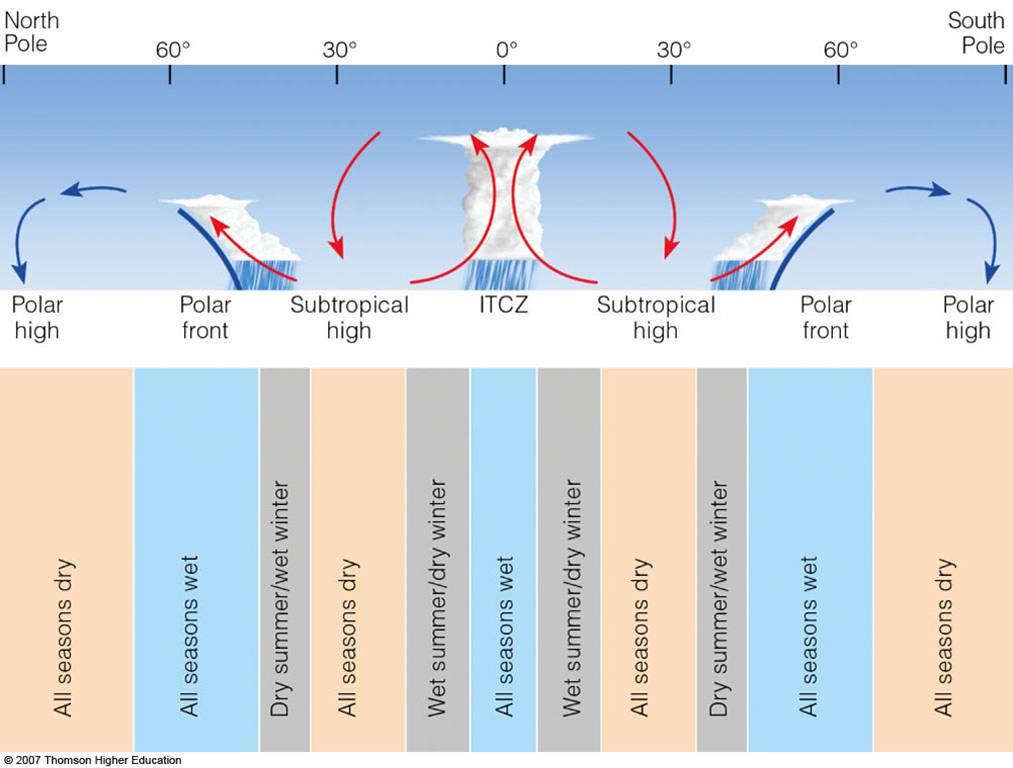
Source of above graph: http://apollo.lsc.vsc.edu/classes/met130/notes/chapter17/glob_prec_w.html
For example, I suppose that the shift of precipitation from summer to winter, observed in Iran for the past several thousand years, is one of the results of the movement of Earth's coating.
Fig. 1. Rainfall over Iran [42.5_ Ee65.5_ E; 25_ Ne41_ N ] for 6 ka BP to present (blue line) and the solar insolation [W/m2] at 31_ N (red line) from ECHO-G simulation during (a)
Summer (JJA) and (b) Winter (DJF). Time-series are smoothed using 201 years running mean. (For interpretation of the references to color in this figure legend, the reader is referred to the web version of this article.)
Source of the above graph:
Towards modeling the regional rainfall changes over Iran due to the
climate forcing of the past 6000 years
Bijan Fallah * , Sahar Sodoudi , Emmanuele Russo, Ingo Kirchner, Ulrich Cubasch
Institute of Meteorology, Free University of Berlin, Carl-Heinrich-Becker- Weg 6-10, 12165 Berlin, Germany
Earth is flattened at the poles and when Earth's coating rotates, this flattening moves closer to the equator. That is when the moment of inertia of Earth's rotation increases and its speed of rotation decreases. When Earth's coating returns to its equilibrium position (which is when both magnetic and geographic poles are next to each other), the speed of Earth's rotation increases because the moment of inertia decreases.
Currently, the magnetic field moves eastward, toward the geographic pole, increasing the speed of Earth's rotation. It demonstrates that Earth's coating is returning to the equilibrium position. What will be the next moves of the magnetic pole and Earth's coating and what will they bring?
Cyclical waves of increase in the number of earthquakes in the Mediterranean and Poland (see Fig.2.) observed in the period 750 BC to AD 2000 confirm the movements of Earth's coating. The number of earthquakes rises when the Mediterranean region moves closer to the equator, where the tectonic stress is increased. It is exactly what we are currently observing in Italy. There is an increase in the frequency of earthquakes in the Mediterranean and Poland during periods of large shifts of Earth's coating, i.e., up to 7000km in the years AD 250-700 and 1250-1860.
Fig.2. Variability of the number of significant earthquakes in the Mediterranean and Poland between 750 BCE to AD 2000
Based on archival data about earthquakes registered in the period from AD 998 to AD 2000 in
Poland ( Pagaczewski 1972); ( Guterch , Lewandowska -Marciniak 2002) and earthquakes
registered in areas adjacent to the Mediterranean basin in the 750 BC period. it's AD 995
( Guidoboni et al. 1994) a set of high-intensity earthquakes containing 417 events was
prepared. Based on the above set, a diagram of seismic activity in Europe was made in
the period between 750 BC and AD 2000. showing the variation in the number of shocks over
time.
The c easeless movement of Earth's coating, causing cyclical and regional climate changes, causes the birth, rise, and fall of civilizations and empires developing from east to west (in agreement with the movement of Earth's coating and climate zones) in the historical civilization of Indo-European and Asian civilization.
References
Guidoboni Emanuela , Comastri Alberto, Traina Giusto 1994: Catalog of ancient earthquakes in the Mediterranean area up to the 10th century , Instituto Nazionale de Geofisica , Rome
Guterch Barbara, Lewandowska – Marciniak Hanna 2002: Seismicity and seismic hazard in Poland, Folia Quaternaria vol.73, Kraków.
Pagaczewski J. 1972: Catalog of earthquakes in Poland in the years 1000-1970, Materials Works of the Institute of Geophysics of the Polish Academy of Sciences no. 51, Warsaw.
-
Causes of the fall of the Western Roman Empire
It is a part of my book entitled A modern look at the Earth's climate mechanism and the cosmo -geophysical system of the Earth, published online.
Between the birth of Christ and the fall of the Western Roman Empire, the earth's coating shifted relative to the ecliptic over 7000 km across the earth's surface. There was then the seeming change in the location of the northern magnetic pole, whose movements were determined by research by:
Gullaume St-Onge and Joseph S. Stoner, Paleomagnetism near North Magnetic Field,
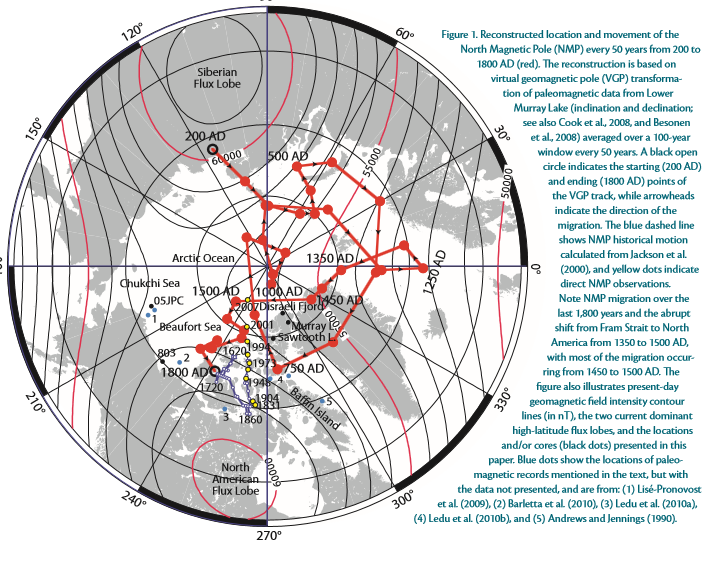
Fig.3. The apparent movement of the North Magnetic Pole around the geographic north pole
Source of the above graph:
St-Onge, G., and J. S. Stoner. 2011. Paleomagnetism near the North Magnetic Field: A unique vantage point for understanding the dynamics of the geomagnetic field and its secular variations. Oceanography 24(3):42–50, http://dx.doi.org/10.5670/oceanog.2011.53 .
From the above studies, it appears that the north magnetic pole has apparently moved about 7 degrees latitude and 180 degrees of longitude (about 7,000 km) from Siberia (Lena's mouth) northwest to Greenland (around the land of Francis Joseph). Associated with this seeming shift of the north magnetic field take place, the rotation of the earth's coating (Góralski 2017 B) caused that the Asian territories occupied by the Mongol tribes were in a drier climatic zone. It led to the long drought in the summer and strong snowy winters in which extinct the herds of animals owned by the Mongolian tribes. It led to the migration of the Mongolian tribes towards the west that in the IV-V centuries they reached Europe as Huns.
At the same time, with the shifting of the earth's coating to the south, northwestern Europe ha s found itself in the period 0-400 AD in the warmer climate which caused progress in agriculture of German tribes (and drought in Palestine and southern Europe, where drought then caused the food crisis). It is confirmed by the increase of earthquakes in the area of the Roman Empire (see Fig.2) in this time what means that this region of the Earth was closer to the equator then earlier before Christ birth. See explanation in my work (Góralski B. 2017B).
This above warming of the European climate resulted in an increase of the population of the Germanic tribes and the increase in their importance in the society and the army of Rome. Then, during the period 400-500 AD, the reverse movement of the earth's coating caused Western Europe to find itself in a colder climatic zone. It caused crop failure and hunger in the Germanic land. It resulted in their mass migration southward to the lands of the Western Roman Empire. The emergence of Huns in Europe accelerated the migration of the Germanic tribes into Rome. The Huns' invasion of central and western Europe and the invasion of the German tribes into southern Europe caused the fall of the Western Roman Empire. Other consequences of the cyclical movement of the coating of Earth are described in my book available online in the Polish language entitled "Historia naturalna and changes climate ".
-
Modern history and changes in the location of the earth's coating
Before the French Revolution, western Europe shifted south because the earth's coating was shifting so that North America simultaneously traveled to the North. North America's wandering in the North direction marks in the worsening of climate before the moment of the outbreak of a civil war in the US in 1864. The Civil war was probably caused by crop failures in the northern states of the United States what was the cause of the war with the fertile states on the South of the US, which had a better climate for the crop vegetation.
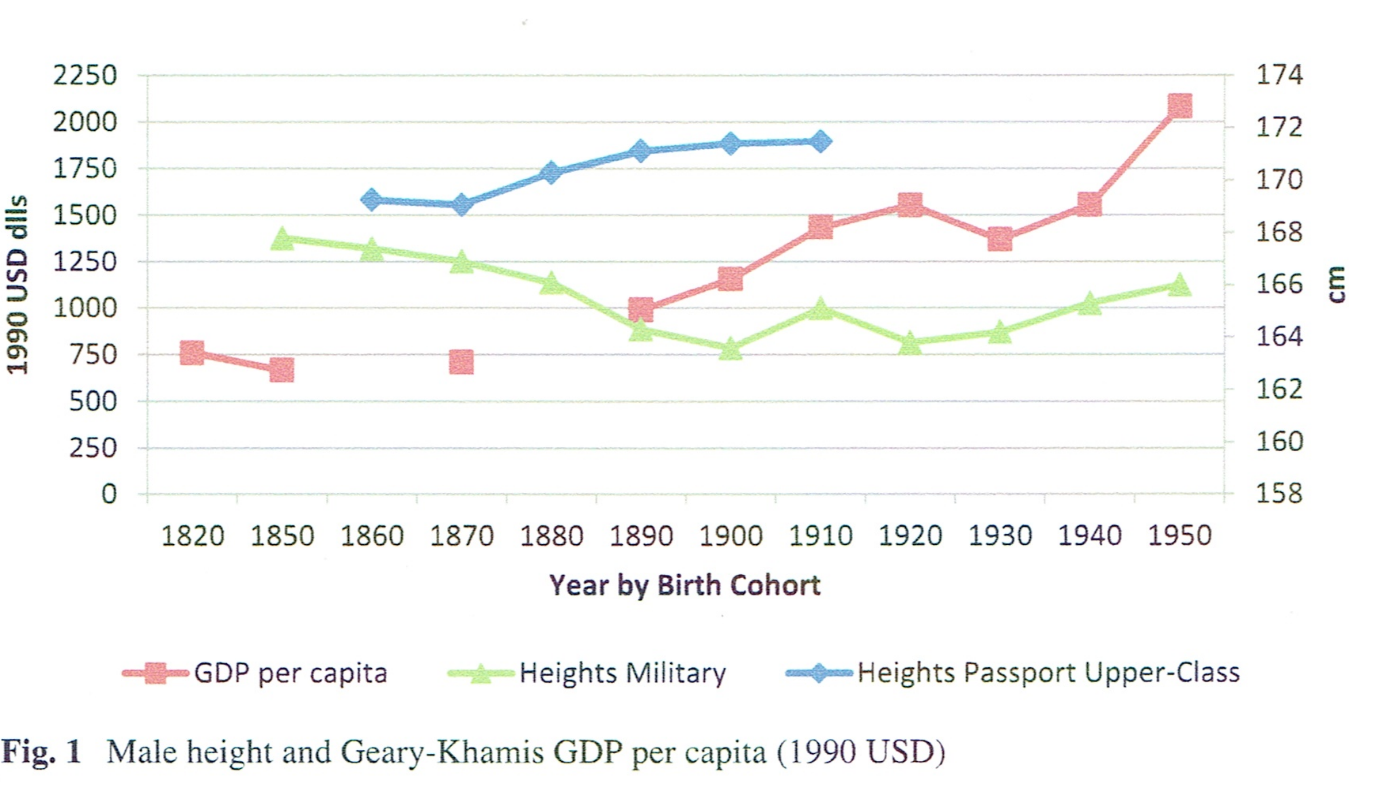
Fig. No. XX Male height in Mexico per GDP
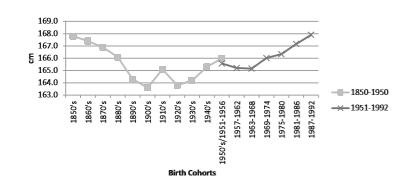
Fig.no.XXX Male mean height trends in Mexico, by birth cohorts: 1850–1992
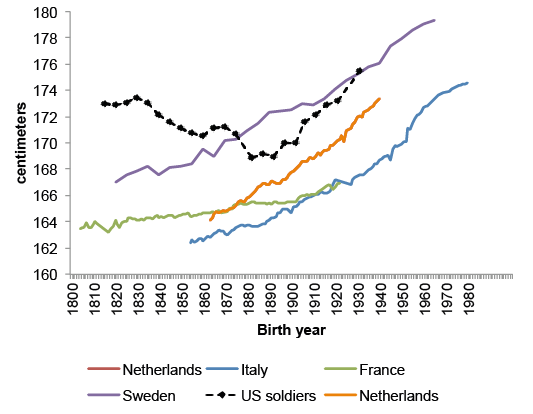
Fig.no.XXX Mean heights of volunteer soldiers in the US and in selected countries with prescription
Source of the above graph and below excerpt:
Biased samples yield biased results: What historical heights can teach us about past living standards
Howard Bodenhorn , Timothy Guinnane , Thomas Mroz July 22, 2015
Link:
https://voxeu.org/article/what-historical-heights-can-teach-us-about-past-living-standards
Figure in above reports mean heights of soldiers for six countries over the 19th and 20th centuries. The US experience, where mean height apparently decreased by about 5cm (about two inches) from 1830 to 1880, is an example of the industrialization puzzle. This result supports an extremely pessimistic understanding of how industrialization affects human welfare. It is one thing to argue that industrialization's benefits were unevenly distributed or at first sight. The industrialization puzzle implies that at least in the short run, economic modernization made the average person worse off. How could this be? The finding that people shrank in a growing economy, as John Komlos puts it, led to a number of possible explanations for the puzzle. Most focus on the quality and availability of food supplies, the intensity of work effort, and the undeniably unhealthy living conditions of early industrial workers in both the US and Europe. The possibility that people could be worse off (as measured by their height) while real wages were increasing led Komlos to posit that the 'biological' and the economic standards of living might diverge during industrial revolutions.
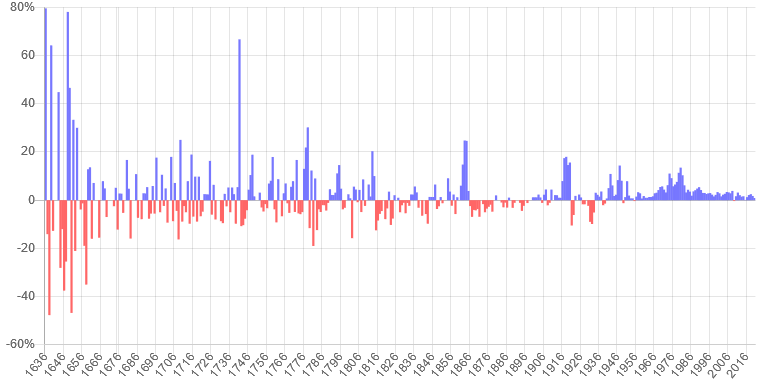
USD Inflation since 1635
Annual Rate, the Bureau of Labor Statistics CPI
Link: https://www.officialdata.org/us/inflation/1800?amount=1
After Díaz's overthrow, Francisco Madero [3] took power , enjoying the support of peasant leaders Francisco Villa in the north and Emiliano Zapata in the south. The slogan of the new revolutionary authorities was " Tierra y Libertad ", meaning land and freedom [3] . The first part of the slogan referred to the expropriation of powerful hacienda owners. Emiliano Zapata, who demanded faster agrarian reform from the Madero government, was a particular opponent of the latifundia system . Before the revolution, 97% of the arable land was owned by 1,000 families, the church and foreigners. Peasants owned only 2% of the land and the remaining 1% belonged to the commune [5] . President Madero was a supporter of liberal democracy and a reformer, but he could not agree to the demands of peasant leaders due to the compromise made with the supporters of the deposed Díaz . Seeing the government's subsequent attempts to negotiate with loyalists of the overthrown regime and the delay in reforms, Zapata withdrew support for Madeira and took power over the state of Morelos [4] .
https://pl.wikipedia.org/wiki/Rewolucja_meksyka%C5%84ska downloaded on 20/02/2020 at 16:25
Source of the Graph: Luis Bértola · Jeffrey Williamson Editors, Has Latin American Inequality Changed Direction? looking over the long run, Springer Open.
The growth curves of soldiers in the USA and Mexico show that from 1800 to 1890 the biological living conditions of the human population on the North American continent deteriorated. This was related to the shifting of the earth's crust northward in North America in the period 1800-1860. Since 1860, the return movement of the crust and the shifting of climatic zones and precipitation zones over the surface of the shifting Earth's crust began. The cultivation of cotton in the southern states is evidence of the rainless weather that cotton likes . Biological conditions for the human population were deteriorating due to changes in land productivity associated with worsening climatic conditions. The reduction in yields per acre of farmland was associated with a shorter growing season in the north and reduced rainfall in the south of North America, i.e. in Mexico. This is difficult to observe in American agriculture due to the enormous increase in US agricultural production resulting from the increase in the number of settlers and their farms. In the south, there was a slave system in cotton cultivation (which was always in great demand with the increasing population), which gave financial independence to southern states striving for secession. The abolition of slavery was the argument of the northern states to prevent the secession of the US South because it caused their economic decline and economic dependence on the northern states. The Taiping Rebellion in China was almost simultaneous with the US Civil War.
Climate Effects and Stature since 1800
Lots of historical data at the link: https://clio-infra.eu/
US growth chart and data since 1700:
https://clio-infra.eu/Countries/UnitedStates.html
During the French Revolution, the climate zone with winter rainfall and dry summer found itself above France, i.e., France had to move deeply into the zone between 50-30 degrees of latitude. In July 1789, heavy rains during the harvest destroyed the crops and led to famine in Paris, which caused the outbreak of the revolution. From 1860, the area of France wandered north and is now at latitude 48 ° 51 '52.9776' 'N
IV Climate change and the French Revolution
Halina Lorenc ( Lorenc 2001), based on instrumental measurements at the Warsaw Astronomical Observatory since 1779, separates the coldest thermal period in the range 1801-1889 with the coldest sub-period in 1811-1820. During those 220 years, the coldest year was in 1829 , with an average annual temperature of only 4.7ºC with a multi-year average of 7.7ºC. There are two periods in the measurement data series:
- a period with a negative deviation from the 220-year average in 1781-1890
- a period with a positive deviation from the long-term average in 1891-1999.
The author points out the reason for the cooling of the nineteenth-century on absolute minimum solar activity (the weakest 13-year cycle of sunspots in the period of 1811-1823) and the increase in dustiness of the atmosphere in the peak of volcanic activity (volcanic eruptions of Tambora in 1815 and Coseqina in 1835). In 1883 a volcano erupted on the island of Krakatau. The previous eruption took place in the 17th century. The author combines the rise in temperatures in the 20th century with the increase in solar activity and the decreasing activity of volcanoes. The influence of volcanoes on the climate is raised in his work by Ch.D. Schônwiese ( Schônwiese 1997). He writes that in the last 40,000 years almost every continental or mountain glacier progress has been associated with a period of increased volcanic activity. In the period 1815-1912, all volcanic eruptions had a VEI (volcanic explosivity index) of 5 or 6. Today, eruptions have a VEI of 4. This indicates less volcanic activity.
Fig.4 . SPEI record JJA(wet and dry summers in Fontainebleau) versus total sunspot numbers SSN (color orange right scale) in 1750-1904.
Source of values:
Yearly mean total sunspot number: WDC-SILSO, Royal Observatory of Belgium, Brussels
link: http://sidc.be/silso/DATA/monthssn.dat
Source of values: SPEI rec JJA from the publication -
Authors: Inga Labuhn , Valerie Daux , Olivier Girardclos , Michel Stievenard , Monique Pierre, and Valerie Masson- Delmotte
# Published_Date_or_Year : 2016-05-03
# Published_Title : French summer droughts since 1326 CE: A reconstruction based on tree ring cellulose d18O
# Journal_Name : Climate of the Past
#Volume : 12
# Pages: 1101-1117
#DOI : 10.5194/cp-12-1101-2016
# Online_Resource : http://www.clim-past.net/12/1101/2016/
# Full_Citation :
# Abstract: The reconstruction of droughts is essential for the understanding of past drought dynamics and can help evaluate future drought scenarios in a changing climate. This article presents a reconstruction of summer droughts in France based on annually resolved, absolutely dated chronologies of oxygen isotope ratios (d18O) in tree ring cellulose from Quercus spp. Samples were taken from living trees and timber wood from historic buildings at two sites: Fontainebleau (48 23'N, 2 40'E; 1326-2000 CE) and Angouleme (45 44'N, 0 18' E; 1360-2004 CE). Cellulose d18O from these sites proved to be a good proxy of summer climate, as the trees were sensitive to temperature and moisture availability. However, offsets in average d18O values between tree cohorts necessitated a correction before joining them to the final chronologies.
Using the corrected d18O chronologies, we developed models based on linear regression to reconstruct drought, expressed by the standardized precipitation evapotranspiration index (SPEI). The significant correlations between the SPEI and cellulose d18O (r~= -0.70), as well as the verification of the models by independent data, support the validity of these reconstructions. At both sites, recent decades are at risk of increasing drought. Fontainebleau displays dominantly wetter conditions during earlier centuries, whereas the current drought intensity is not unprecedented in the Angouleme record.
While the d18O chronologies at the two studied sites are highly correlated during the 19th and 20th centuries, there is a significant decrease in the correlation coefficient between 1600 and 1800 CE, which indicates either a weaker climate sensitivity of the tree ring proxies during this period or a more heterogeneous climate in the north and the south of France. Future studies of tree ring isotope networks might reveal if the seasonality and spatial patterns of past droughts can explain this decoupling. A regional drought reconstruction based on a combination of the two sites shows good agreement with historical records of grape harvest dates in France, which provide another proxy of summer climate.
Fig. 5. Summer temperature reconstructions in Europe in the years 1400-2000
We rely here on air temperature reconstructions during the summer periods described at work:
Raymond S. Bradley, Philip D.Jones , “Little Ice Age” summer temperature variations: their nature and relevance to recent global warming trends , The Holocene 3.4 (1993) pp. 367-376
http://hol.sagepub.com/content/3/4/367.abstract
In BR Mitchell's book, European Historical Statistics 1750-1975, there is data on annual atmospheric precipitation in major European cities in the period 1750-1975. I used this data to create the following chart showing the variability of rainfall during the period 1773-1800 in Paris-north of the Alps, and Milan-south of the Alps:

Fig. 6. Precipitation in Paris (blue color) and Milan in 1773-1800 in mm / year. Author of the drawing Bogdan Góralski
The graph shows a negative correlation where greater rainfall in Milan is accompanied by less rainfall in Paris and vice versa. The graph also shows the increasing rainfall trend in Milan - magenta and the decreasing rainfall trend in Paris - blue. From 1787, the Paris chart shows a progressive fall in rainfall from 600mm / year to less than 400mm / year. It is important to know that wheat used for baking bread needs up to 500mm of rainfall during the growing season. Reducing the sum of rainfall during the growing season reduces yields by up to 40%.
Precipitation below 400mm / year, which was recorded in Paris in the period 1790-1796, probably significantly reduced the yield of wheat, from which bread was the basis for feeding folk masses. Because grain deliveries from further regions of France were unprofitable due to customs duties and transport costs, and heavy rains at harvest time reduced crops in 1789, the Paris district suffered famine, which translated into the revolutionary behavior of the French people used by the revolutionary elites to overthrow royal power and the political system France.
Historical literature describes problems with drinking water supply on the eve of the Paris revolution. There was solved only by Napoleon, who built a channel to clean water to Paris. Drought in the Paris region in the period immediately preceding the French Revolution resulted from climate change associated with the Dalton Minimum - a decrease in solar activity. A similar decrease in solar activity is expected in 2019-2040.
V. The demographic, socio-economic situation of pre-revolutionary France.
The population of France grew from 16.8 million in 1650 to 34.9 million in 1850 ( Szpak 1997: 129). From 1769, it was an approx. 15% increase in the French population (from 25 million to 29 million) (Dupâquier1988: 67). It is likely that boys among the newborn predominated, which caused the masculinization of French society. Aggressive young men probably dominated the French revolutionary elites. The possibilities of reducing the French population by emigration have been lost out by short-sighted foreign policy because France lost to England in competition for North America. In America in 1760. there were 2 million English colonists and only 60,000. the French citizens ( Rostworowski 2006: 386). The war with England in defense of American independence consumed 2 billion livres borrowed at 10-12%.
In 1789, the public debt increased to 4.5 billion livres. He tripled during the 15 years of the reign of Louis XVI. At the time of the death of Louis XV, servicing the debt required 93 million a year, and in 1790 it reached 300 million in the budget, whose income barely exceeded 500 million livres ( Mathiez 1953: 23). This avalanche increase in the treasury debt of the king was probably due to the enormous inflation forced by the multiple increases in food prices that began at that time in the world. The food crisis was a derivative of a shift to the north of Europe, which led to a shift of rainfall to winter, and the cooling of the climate that occurred at that time (see Fig. 5 summer temperature chart for central Europe). Treasury cash revenues reduced by inflation were not enough to meet the needs of the apparatus of the French kingdom. This stopped the French expansion in America and indirectly contributed to the outbreak of the French Revolution. If a few million French people left for North America, social problems in France would be reduced, and a revolution might not have happened. On the eve of the revolution, the population of France reached the maximum numbers for a given territory and the given social conditions during favorable climate and economic conditions during the reign of Louis XIV and Louis XV. It is demonstrated by falling since 1780. the crude birth rate for the French population (Fig. 7).

Fig. 7. Total European and Japanese fertility Data from 1801-1950 from the European part of Russia come from (Glass 1965: 97 tab.20). (author of the drawing Bogdan Góralski). Birth rates (crude birth rate) in populations covered by revolutions and wars from 1750 to 1955. Dark violet -Russia, violet-Germany, dark blue-Austria, brown-Japan, light blue-England, green-Italy, yellow-France.
Date 1750-1840 for France. David Victor Glass, World Population, tab. p. 101
Date 1841-1955 for France, Germany, England, Austria DV Glass, World Population, tab. pp. 68-69
Date for Austria-Hungary until 1906.
To calculate the birth rate in the English population, data from the book Wrigley EA, Schofield RS, "The Population History of England 1541-1871. A reconstruction. London 1981:
Data from Table 7.8 on pages 208-209 on the size of the population: Quinennial English population totals 1541-1871
Data from Table A2.3 on pages 496-502 about the number of births.
Data from these two tables above were used to calculate the crude birth rate in England
Date 1801-1950 for the European part of Russia: David Victor Glass, World Population, table 20, p. 97
Data for Japan: from 1911-1943 from the Statistical Year-Book of the League of Nations, p. 41
Data for Italy: David Victor Glass, World Population, tab. p. 68.
People who were born from 1769 during the growth of the French population, in the period before the revolution they reached maturity. It is obvious that they wanted to live normally, have children, and work. Probably their chances of success in life in France of Louis XVI suddenly deteriorated due to the sharp climate crisis causing bad harvests and great inflation as well as the even worse financial situation of the state. The climate crisis associated with the rapid cooling of the climate of Central Europe in the period 1780-1815 is evidenced by reconstructed summer temperature anomalies (see Fig. 5 - graphs No. 5 for Central England and No. 6 for Central Europe) (Bradley , Jones 1992).
VI. Structure of the society of pre-revolutionary France
The social structure of French society was also revolutionary, in which the nobility and aristocracy were a minority, constituting about 1% of the total:
Higher clergy (archbishops, bishops, abbots, priories, canons, etc. 10,000
Lower clergy (priests, vicars, priests without benefits, etc.) 60,000
Religious clergy 60,000
Nobility (including 40,000 old nobility) 173,000
Townspeople - buyers, industrialists, intelligence 500,000
Average condition - artisans, small buyers , etc. 2,925,000
City proletariat 2,385,000
Farmers, possessors ( fermiers ), merchants, craftsmen 750,000
Peasants owning lands 15,333,000
Farmless peasants 5,354,000
Total 27,550,000 (Macleod- Machlejd 1934: 63),
The climate crisis-affected rising food prices primarily for city and town dwellers, i.e. the average state and urban proletariat - a total of 6 million French. Farmless peasants, of whom there were over 5 million, also felt painfully the food prices in those years, which is demonstrated by the work Wages, Prices, and Living Standards in China, Japan, and Europe, 1738-1925 (Allen et al. 2012).
According to the above work, wheat prices pulsed and rose three to four times in London from 1790 to 1815, which probably means the same increase in France.
The population dissatisfied with the crisis of the state, worsened by the climate and food crisis, reached the size of more than 11 million French, who became a revolutionary mass. The elite, blamed for the crisis, numbered only 303,000 nobility and clergy and were in the minority against the 500,000 revolutionary bourgeoisie fearing the bankruptcy of the state and the forfeiture of the money lent to it. The revolutionary elites included Protestants and Jews who had been persecuted earlier and who had obtained equal rights and civil rights as a result of the revolution.
Artur Young, in a report from a trip to pre-revolutionary France, writes that poor French invested their savings in the ground (Young 1950: 284), probably encouraged by high food prices and the difficulty in making a living during the inflationary state of the French economy. The purchase of small plots of land was hampered by an increase in the stamp tax on real estate transactions introduced just before the revolution, which outraged the French proletariat.
VII. French revolutionary ideology
The layers of the middle class and working intelligentsia created a new revolutionary ideology, which culminated in Napoleon's Code. Along with the decentralization of Charlemagne's monarchy, many local codes of customary laws developed, the number of which after the unification of the state in the fourteenth century reached 700. They were a derivative of the mixing of Roman law, Germanic law, and canon law . This state lasted until the Revolution, and the end of these laws was caused by Napoleon's Code ( Sójka Zielińska 2008: 13-14), which is the culmination of revolutionary ideology.
Jean Jacques Rousseau, a supporter of radical republican democracy and republicanism, put equality at the forefront of human rights. He belonged to the apologists of the state of nature. In his "The Discourse on the Origin of Inequalities Between People" published in 1753, he drew an idealistic picture of primitive times, following the model of the "golden age" described by Ovid in Metamorphoses, when all people were equal and enjoyed unlimited freedom . The beginning of all misery of humanity was the emergence of private property, which caused a permanent division into the rich and the poor, and conflicts introducing "the most terrible confusion" into social life. He sought help against the consequences of the inevitable development of civilization in a social contract in which individuals renounce their natural freedom to the community-people-as a sovereign. In this arrangement, the concept of individual freedom disappeared, and the will of individuals disappeared in the overarching concept of the universal will, volonte general, infallible in the pursuit of universal happiness ( Sójka Zielińska 2008: 35).
Formal subordination of the individual to society is unnecessary because there is a mechanism in society - a feedback loop that gives the individual freedom only when he realizes the will of the superior community - when he satisfies social needs, what I described in previous chapters.
However, the greatest contribution to the ideological foundation of the concept of the natural rights of the individual was made by the French physiocrats. Involved in leading positions in the state apparatus, usually from the middle class or clerical nobility, they were in favor of absolutism, but in the form of "enlightened" as the initiator of top-down socio-economic reforms. The doctrine of physiocrats was based on the assumption that social life is governed by objective rules modeled on natural laws.
Together they form a physical and moral order, guided by the unchanging, absolute laws of nature. The conviction of the necessary compliance of future legislative works with the principles of the law of nature led physiocrats to formulate the thesis on the declaratory nature of the function of the legislator. They were only to learn about objectively existing legal and natural regulations and to record them in the form of "declarations," i.e., announcing legal rules that are consistent with the law of nature. According to Francois Quesnay, "people and their governments do not create laws ... they recognize the laws, and they agree with the highest reason, intellect, that governs the world, i.e., they declare these laws."
For another physiocrat Dupont Nemours, "decisions that we call positive law should be nothing more than declaratory acts." The physiocrats used the concept of inherent, natural human rights, and made the category of one and individual property the focal point of their system. It included both "person's property," i.e. , personal freedom understood as the freedom to dispose of yourself and your skills, as well as ownership of things, such as economic freedom, the freedom to freely dispose of wealth, and increase wealth. They sought to lift all feudal restrictions regarding the possession and circulation of land, the land they considered as the basic wealth of the country ( Sójka Zielińska 2008: 35-36). I think that the notion of ownership and inheritance, which they believe is a source of inequality, needs to be studied to achieve modern social progress. I did this in my work on establishing the global POL-CAT enterprise, which will have indivisible and non-inherited property, ensuring economic freedom and safety for employees-shareholders.
VIII. Food prices and the agricultural structure of feudal France
The bad climate in France lasted from the end of the 17th century due to the continuing Little Ice Age.
"Oppression and misery begin around 1672. At the end of the seventeenth century (1698), the memorials, edited by the authorizing officers of the Duke of Burgundy, say that many poviats and provinces have lost their sixth, fifth, fourth, and even a third of the population, and some up to half "," In 1725, Saint-Simon writes: "next to the luxury life in Strasbourg and in Chantilly, Normandy feeds on grass (" Taine 1881: 321-322).
Perhaps the decrease in the rural population was due to the high concentration of agricultural property before the revolution due to the low prices of agricultural production. The landless rural population moved to the cities and constituted the urban proletariat. The concentration of agricultural ownership also resulted in a decrease in the production of agricultural produce, which was a market reaction to the reduction of food prices before the revolution. This caused hunger among poor social loss. At the same time, low food prices cause better nutrition for richer population groups and an increase in the number of boys' births, which causes masculinization of the population and an increase in its aggressiveness.
Wheat and food prices depend mainly on climate change affecting the increase in crop per unit of cultivated area. Changes in wheat prices over the centuries are shown in the charts below:
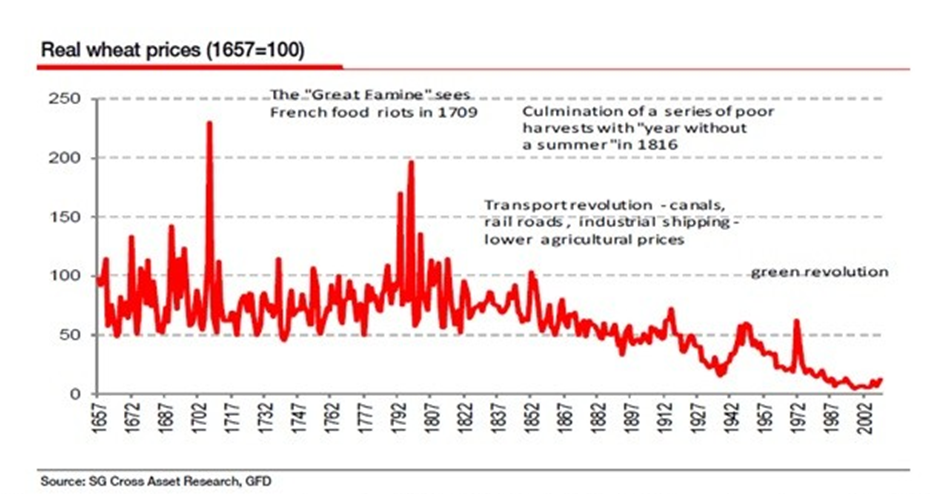
Fig. 8. Real wheat prices 1667-2002
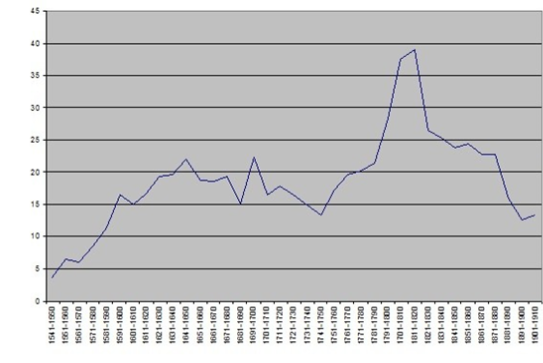
Fig.9. Wheat prices in London in German marks 1541-1910
The chart below illustrates the impact of food demand on its prices and increasing the area of crops in Lower Normandy in the years 1397-1956.
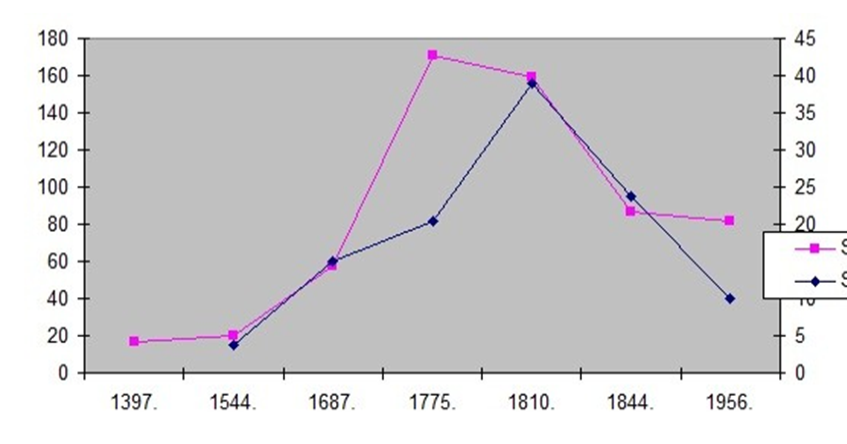
Figure 10. Increasing the cultivated area in response to the increase in food prices in Lower Normandy in the period 1397 -1956 on the example of the villages of Beaurfour and Vitotel
Date Series:
Purple - area of crops in the villages of Beaufour and Vitotel in Lower Normandy according to André Plaisse (1965) in hectares (left scale).
Blue - real prices of wheat in London by Wilhelm Abel (1935) in German marks.
Wheat prices have risen in London (and grain markets have shaped similar prices everywhere) since 1544 due to the demand of the growing English (and French population) and growing with the prices the areas of arable crops (demand shapes supply). Around 1810, there was a solstice and wheat, food prices began to decline, and with them the area of arable crops. What resulted in these changes? During this period in Europe lasted the Little Ice Age associated with minimized solar activity so. Maunder minimum and Dalton minimum. Deterioration of climatic conditions during the minima of solar activity and the accompanying decrease in yields per hectare and the growing population forced an increase in prices of agricultural produce, which prompted producers to increase the cultivation areas. At the same time, there was a phenomenon of deconcentrating of agricultural property, consisting of reducing the average area of agricultural property. The population bought small agricultural plots to cultivate them and survive in the conditions of rising food prices. After 1820, there was a decline in wheat and food prices, and a downward trend in the area of arable crops followed, as well as after the Spring of Nations, concentration of agricultural property - increasing the average area of agricultural property , which continues to this day and led to the creation of large agricultural latifundia (very big farms) in Western countries. This phenomenon did not occur in Asia (China has recently departed from large-scale rural communes) , and currently, the Asian agricultural system is based on the lease of small plots of land cultivated by a very large population of Asian farmers.
The phenomenon of deconcentrating and concentration of agricultural property is visible in the figure below, illustrating the change in time of the average area of agricultural property. The phenomena of deconcentrating agricultural properties took place in the period preceding the French Revolution and during the Napoleonic Wars ( Plaisse 1965: 94 Tab. No. 18), and today they continue in the most overpopulated countries of the world.
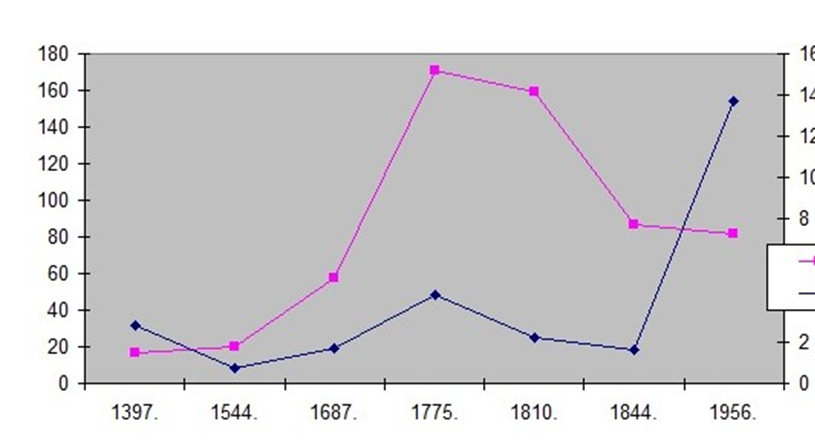
Figure 11. Changes in crop area and agricultural structure in Lower Normandy during the period 1397-1956 on the example of the villages of Beaurfour and Vitotel
Date Series:
Purple color - area of agricultural crops in the villages of Beaufour and Vitotel in Lower Normandy
by. André Plaisse (1965) in hectares (left scale).
Blue - the average surface of agricultural property in the villages of Beaufour and Vitotel in [ha]
IX. Pre-revolutionary period and the image of feudal France
The harsh winter of 1708/9 and hunger caused by the over frozen crops killed 2 million French people.
"In 1739, Argenson writes in his diary:" Crop failure just started an uprising in three provinces: in Ruffec , Caen, and Chinon . Women who carried bread were killed on the roads ... "(...) In 1740 Massillon, bishop of the Clermont-Ferrand dioceses, writes to Fleury:" Our villagers live in terrible misery, without beds, without equipment, and most through half a year there is not even barley or oat bread, which is their only food and which they must take from their mouths and children mouths and pay taxes” (Taine 1881: 322).
"In all cities, every townsman is required to feed one or two paupers and give him fourteen pounds of bread a week. This winter, the city of Châtellerault (with four thousand inhabitants) had 1,800 similar poor people this winter" (Taine 1881: 323).
Famine uprisings broke out in 1747 Toulouse, 1750 in Béarn , and in 1752 near Rouen, Delfinat and Auvergne, Arles. In Normandy itself, hunger uprisings occurred in 1725, 1737, 1739, 1752, 1764, 1765, 1766, 1767, 1768. Similar uprisings occurred in 1772 in Reims, in 1775 in Dijon, Versailles, Saint-Germain, and Pontoise and in Paris , in 1782 in Poitiers, in 1785 in Aix en Provence, in 1788 and 1789 in Paris and all of France.
"Admittedly, under Louis XVI, governments are softening, the authorizing officers are becoming more human, the administration is improving, the personal tax is evening out, the serfdom is slowing down (the fourth part of working days in the year falls on serfdom ( Taine 1881: 324)) and transforms, in a word the misery decreases; with all this, it is still too great for human nature to bear" (Taine 1881: 325-326).
This situation must have resulted in bad social moods caused by problems with feeding the population. Problems with food determine the background of a conflict situation. Feeding in France has deteriorated over the centuries. By. Massimo Livi-Bacci ( Livi-Bacci 1991: 83-84 Table 15):
in 1480, there were 4,163 calories per head of a French resident,
in 1580-90 4917 calories,
2840 calories in the years 1600-1700,
in the years 1754-67 1740-2000 calories,
in 1780, 1950-2350 calories,
in the years 1781-90 1753-2130 calories,
in the years 1803-12 1846 calories,
in the years 1845-54 2480,
3220 calories in 1885-94.
The data presented above show that in the pre-revolutionary period the nutritional situation of French society was very bad, but in the 1790s in Western Europe, there was the most severe climate crisis of the last centuries - a sharp climate change (see Fig. 5). This resulted in a huge increase in food prices, total hunger in France and an outbreak of the revolution. Famine in French society caused the deconcentration of land ownership by the desire to set up small farms that had been built before the revolution. The deconcentration of agricultural resources in France before the French Revolution was forced by rising food prices (huge fallow areas, difficult climate conditions, and terrible logistics in food transport limited food supply) and the proletarianization of rural society.
The French Revolution was directed against the feudal state and its structures. In the second half of the 18th century, there were about 42,000 parishes in France per of 55,600 km² (for example, there are now about 9,600 parishes per 312,000 km² in Poland). The parishes made a living off tithes and owned farms. There were 13 km² of France per parish. On the French-Dutch border was one parish per to 5 km², and one parish or associated church to 3 km² ( Litak 2004). About 120,000 people belonged to the clergy. About 10% of the arable land belonged to the church. The church's income from landed estates and tithes amounted to around 220 million livres, and thus ⅓ of the French treasury (Markov, Soboul 1984: 15). During the food crisis, such a wealth of clergy had to cause conflicts and aggression. The share of 20 million French peasants in arable land was about 35%, which is why it was small (in the 18th century the number of small farms increased significantly (Taine 1881)).
"According to the best viewers," a quarter of the soil is fallow, "" (...) "The agricultural association in Rennes announces that two-thirds of Brittany are fallow. (...) "In the Confolens district, a piece of land leased in 1665 for 2965 Livres will not bring (in 1747) higher than to 900 Livres. On the border between Marche and Berry dominion, which in 1660 could feed two families well, is now a shabby, nothing-bringing farm" (Taine 1881: 328-329).
This is due to the climate crisis of the Little Ice Age limiting income and agricultural production from small farms of agricultural land and the king's tax policy. Under Louis XVI from 1774 future economic stagnation followed by recurring crises. Bad weather conditions (harsh winters, unfavorable for agriculture in the spring, probably high rainfall ("The once flourishing Sologne turned into swamps and forests; a hundred years ago it gave three times more abundant crops" (Taine 1881: 329)), and since 1784 to 1788 - a series of bad years - crop failure, sheep and cattle plague cause an economic crisis. In 1787, the French treasury deficit amounted to 140 million livres with a budget of 640 million. The French tax system was very repressive and the taxed citizen paid an average of 53% of tax from income (Taine 1881). Nobility and clergy were practically freed from taxes, which provoked the indignation of the rest of society. In this situation, attempts to enact new taxes: the new land tax- was particularly severe for hundreds of thousands of small farms newly established during the 18th century and stamp tax - from real estate transactions, brings revolutionary social protests and discontent out of government. The Great French Revolution breaks out against the conspiracy of the feudal state and its structure based on aristocracy and clergy. The bad situation of the French people was caused by the climate crisis. Markov, Soboul (Markov, Soboul 1984: 27) write about the situation of the French people, and I quote:
"The main problem of the employed was the uncertain purchasing power of their earnings. The uncertainty in the price increase affects them in different ways depending on their family budget. Because cereal prices increased more than all others, this burdened simple people above all, since , firstly, the number of children here was the highest, and secondly, bread was his main food. E. Labrousse calculated that purchase of it accounted for 50% of the family budget; 16% fell on vegetables, fruit, fat, and wine , 10% on clothing, 6% on fuel and light, meat could only be eaten very rarely. The author concludes that the cost of living in the period 1771-1789 compared to 1726-1741 increased by 45%, and in the years 1785 -1789, even by 62%. Seasonal fluctuations were even higher. After a great crop failure in 1788. the price of bread soared that poorer workers had to spend 58% on bread alone, and in 1789. up to 80% of their earnings "
"Wheat bread cost as much as today, three to four sold per pound, but the man's daily income, instead of forty, was only nineteen sold" (Taine 1881: 330).
"Artur Young, using similar insights and calculations, comes to the conclusion that in France" rural workers - and this is the most numerous class - are 76 percent the worse than in England, that is 76 percent worse are fed, clothed, kept in health and sickness, "(...)" in the eighth, eighth parts of the kingdom, there are no tenants at all, only the sharecropper "(Taine 1881: 331).
On July 13, 1788, there was a monstrous storm with hail that killed people and animals, which in northern France destroyed hundreds of square miles of grain just before harvest, and the long spring drought did not allow the grain to grow (Doyle 1990: 86). In 1789-90 there was a good harvest, and in 1791 wasted. In the winter of 1792, the people attacked stores and wholesalers.
Food prices in Europe fell until 1750 and then began to rise sharply until 1830 (Fig. 8). This must-have affected the French population, which, using Napoleon's war genius, sought to feed a large army of millions of males (who had no chance for reproduction) outside of France during the Napoleonic wars. The population of England (from 1700) tends to increase, and from 1800 to rapid development (until 1825), then the growth rate decreases. This is probably associated with the colonial expansion of England, during which the surplus population emigrated to the colonies.
In the period from 1850. food prices in Europe decreased (growing grain imports from the United States and the emergence of potato crops). Food problems with the rapidly growing population (emigrants) were the reason for the US agricultural policy, wherein the years 1860-1880 the number of farms increased from 2 million to 4 million. This gave a development impulse to the entire American economy (Mendelson 1960 ).
X. Scientific and technological revolution versus the causes of the capitalist revolution
• Geographic discoveries and the development of technology and science laid the foundations for economic progress that gave career opportunities and enrichment to dynamic and educated individuals not associated with feudal structures. The great religious reformers challenged Catholic dogmas on which the king and feudal lords were based, creating the ethical foundations of the social structure of capitalism, that ennobled useful human work serving the whole of society.
The conflict between feudal and capitalist systems
• The feudal farming system based on land rent and the hierarchical structure was the best at meeting natural biological needs and is optimal in agriculture.
• The feudal system was based on as the largest number of subjects who paid the rent, and thus increased the number of the rural population
• The capitalist system emerged in response to higher-order mass needs that the feudal system did not satisfy:
• the need for individual freedom,
• the need for equal opportunities for a dignified life,
• the need for a sense of social recognition for an independent individual that resulted from his or her own merits and achievements.
• The capitalist system minimized employment for profit and reduced the number of the rural population
Effects of anti-feudal revolutions
1. As a result of the revolution, power and land passed from the hands of aristocracy and nobility to the hereditary layer of capitalists and bankers (mainly Jews).
2. The capitalist system gave personal freedom, which is limited only by ignorance, but it is more economically restrictive for the citizen than was the feudal system.
3. In the feudal system, the subordinate was subjected to the protection of a feudal lord (local authority), who knew his needs and possibilities better, enabling them to be realized by granting credit and land.
4. In the capitalist system, the citizen is looked after by a central government and a powerful bureaucracy that has limited knowledge of the needs and possibilities of the citizen. The citizen must realize himself on the business market and get a job and capital in the free market.
5. A profit-oriented capitalist system cannot make full use of existing resources and possibilities of producing food for global needs, because profit is achieved by reducing agricultural production
The anti-feudal revolutions were, in fact, a protest against the inheritance mechanisms, whose unethical functioning resulted in the concentration of property in the hands of the feudal lords. This subconscious, instinctive protest was articulated only vaguely in the writings of Jean-Jacques Rousseau. It was not included in the social rules developed by the elite of the French Revolution because it prevented the accumulation of capital by banking elites.
The Russian Revolution, which evolved into a Bolshevik revolution, abolished private property and introduced state or social property, which was not subject to inheritance. It was an economically inefficient solution because it deprived human individuals of the opportunity to stand out by the wealth they gained in life by using other talents and reduced human fate to gray, average, and generally miserable existence.
After the collapse of the Soviet Russia system and the introduction of economic reforms in communist Russia and China, huge fortunes appeared again, and problems with inheritance again arose, the mechanisms of which are widely used to unfairly take over other people's property by various mafias. The Chinese economic maneuver transforming the economy into a free-market planning system was based on a large number of peasants (800 million) supplying the market with food and labor resources in China. Such a maneuver was impossible in Russia because of the murder of the layer of independent Russian intelligence and the most entering peasants during the revolution, the lack of which prevented the reform of the Russian economic system. Also, economic power in Russia passed into the hands of a narrow group of financial oligarchs, mainly of Jewish origin.
One should mention here the Polish system of customary inheritance functioning in former noble Poland. Often there was a transfer of property acquired in foundations for the benefit of society, as well as the creation of a fidei commisum , i.e. family trust that provided daughters with a dowry and sons with education providing a position in the state administration. The fidei commisum also secured retirement benefits for the family. The poorer nobles hand over land to the Catholic Church in exchange for a child pension, which was later prohibited by state law because of the concentration of land ownership in the hands of the Church.
My education and life experience showed me (crucial for the efficiency of the future new economic system) the role of the inheritance mechanism in a just social system. In my opinion, the only chance for a fair and effective social system is to eliminate the mechanism of inheritance of private property and introduce the principle of inheritance of private property by local social organizations. It is also necessary to introduce a new one-tier social organization and a modern feudal system in agriculture.
Warsaw, February 7, 2020. Bogdan Góralski
Bibliography
Abel Wilhelm (1935), Agrarkrisen und Agrarkonjunktur in Mitteleuropa vom 13. bis zum 19. Jahrhundert, Berlin1935.
Allen Robert C., Bassino Jean-Pascal, Ma Debin , Moll-Murata Christine, Zanden Jan Luiten (2012) , Wages, Prices, and Living Standards in China, Japan, and Europe, 1738-1925,
Link to the above work: http://www.iisg.nl/research/jvz-wages_prices.pdf
Bradley Raymond S., Jones Philip D. (1993), “Little Ice Age” summer temperature variations: their nature and relevance to recent global warming trends, The Holocene 3,4 1993 pp.367-376, link to the work : http: //hol.sagepub.com/content/3/4/367.abstract
Doyle, William (1990), The Oxford History of the French Revolution , Oxford New York: Oxford University Press.
Dupâquier Jacques, [ed] (1988), Histoire de la population francaise . 2-De la Reneissance à 1789, Paris: Presses Universitaires de France.
Dupâquier Jacques (1989), Demographic crises and subsistence crises in France, 1650-1725, [in] John Walter, Roger Schofield [eds] Famine, disease and the social order in early modern society, Cambridge New York New Rochele Melbourne Sydney: Cambridge University Press.
Glass DV(1965), World Population,1800-1950 [in] The Cambridge Economic History of Europe, Volume VI, Part 2, Cambridge: Cambridge University Press.
Guidoboni Emanuela , Comastri Alberto, Traina Giusto 1994: Catalog of ancient earthquakes in the Mediterranean area up to the 10th century , Instituto Nazionale de Geofisica , Rome
Guterch Barbara, Lewandowska – Marciniak Hanna 2002: Seismicity and seismic hazard in Poland, Folia Quaternaria vol.73, Kraków.
Livi-Bacci Massimo (1991), Population and nutrition, transl . Tania Croft-Murray, Carl Ipsen, Cambridge N.York : Cambridge University Press.
Lorenc Halina (2001), Trends in climate change in Poland, [in] "Functioning of geoecosystems in diverse morphoclimatic conditions - Monitoring, protection, education", Poznań: Association of Polish Geomorphologists.
Macleod-Machlejd Jerzy (1934), The French Revolution in the Light of Statistics, Warsaw; Paris: skł . main Gebethner and Wolff .
Markov Walter, Soboul Albert (1984), The Great Revolution of the French, Wrocław Warsaw
Mathiez Albert (1956), The French Revolution, Warsaw: KiW .
Mendelson Lev Abramović (1959)., Theory and history of economic crises and cycles, volume I, Warsaw: PWN.
Plaisse André (1965), L'évolution de la structure agraire dans la campagne du Neubourg , Mouton & Co, Paris.
Rostworowski Emanuel (2006), Universal History. 18th century, Warsaw: Wydawnictwo Naukowe PWN.
Schönwiese Ch.D. _ (1997), Climate and man, Warsaw: Prószyński i S-ka.
Sójka-Zielińska Katarzyna (2008), Napoleon's Code. History and the present, Warsaw: Wydawnictwo Prawnicze LexisNexis .
Taine Hippolyte Adolf (1881), France before the Revolution , transl. Piotr Chmielewski, E.Grabowski , Warsaw: S. Lewental .
Wrigley EA, Schofield RS(1981) The Population History of England 1541-1871.A
reconstruction, London: Edward Arnold Publishers Ltd.
Young Artur (1950), Travels in France during the years 1787, 1788, 1789, Cambridge: University Press .
36