ABG Mastery Guide v2.0
From Interpretation to ICU: A Case-Based Clinical Journey
About This Guide
Prepared for Dr. Amir Fadhel — Specialist in Anesthesiology and Critical Care
In collaboration with Sophia (ChatGPT), this upgraded edition of the ABG Mastery Guide is built for high-stakes clinical environments — from rural ICUs to urban operating theaters. It doesn't just teach you how to interpret — it teaches you when to intervene, how often to monitor, and why each number matters in the context of a crashing patient.
ABGs are not passive labs. They are real-time action tools.
This guide transforms acid–base theory into clinical reaction time.
It incorporates:
-
Formula mastery for both simple and complex disorders
-
Advanced tools: Adjusted Bicarbonate, Delta Ratio, A–a Gradient, Base Excess
-
ICU-based intervention grids: thresholds for action, rechecking, and escalation
-
Clinical case drills built for bedside decision-making
-
High-yield calculators and one-page algorithms for real use
This is not a classroom manual. This is an ICU weapon.
📚 Table of Contents
1. Foundations of ABG Analysis
1.1 Core Definitions and Concepts
1.2 The Four Primary Acid–Base Disorders
1.3 The Henderson–Hasselbalch Equation (Applied Physiology)
1.4 pH as a Ratio: The 20:1 Principle
1.5 Blood Gas Sampling, Handling, and Common Artifacts
1.6 Normal Ranges and Clinical Thresholds
2. Rapid Recognition (Bedside Patterning)
2.1 The Five-Step ABG Interpretation Algorithm
2.2 Quick Pattern Recognition in <10 Seconds
2.3 Acute vs Chronic Respiratory Distinction
2.4 Mixed Disorder Clues from pH–PaCO₂–HCO₃⁻ Alignment
2.5 The “Mirror Rule” for Compensatory Direction
2.6 ABG Pitfalls and ICU Traps (O₂ bleed, overventilation, air bubbles)
3. Essential Interpretation Tools
3.1 Henderson–Hasselbalch Equation (Expanded Application)
3.2 Anion Gap (AG) and Albumin Correction
3.3 Delta Gap (ΔAG) and Triple Disorder Detection
3.4 Adjusted Bicarbonate (Advanced HAGMA Tool)
3.5 A–a Gradient (Alveolar–Arterial Gradient)
3.6 P/F Ratio (Oxygenation Index for ARDS Grading)
3.7 Base Excess / Base Deficit (Buffer Reserve Indicator)
4. Compensation Formulas
4.1 Overview and Mechanistic Basis
4.2 Metabolic Disorders (Winter’s & Alkalosis Formulas)
4.3 Respiratory Disorders (Acute vs Chronic Rules)
4.4 Compensation Summary Table
4.5 Recognizing Inappropriate or Overcompensation
4.6 Practical ICU Algorithm for Expected vs Actual Values
5. Mixed Disorder Recognition & Rapid Interpretation
5.1 How to Identify Mixed Disorders at a Glance
5.2 The “Normal pH Paradox” and Hidden Dual Shifts
5.3 Stepwise Approach for Overlapping Patterns
5.4 Triple Disorders and the Adjusted HCO₃⁻ Method
5.5 Case Table: DKA + Sepsis, COPD + Diuretics, ASA Toxicity
5.6 ICU Frequency Rule: When to Recheck ABG in Mixed States
6. Case-Based Learning: Real-World Scenarios
6.1 DKA and Lactic Acidosis: Dual Acid Profiles
6.2 COPD with Sepsis: Mixed Chronic–Acute Disorder
6.3 Post-Hypercapnic Alkalosis in the Ventilated Patient
6.4 Renal Failure with Bicarbonate Retention
6.5 Acute Pulmonary Embolism with Normal ABG Appearance
6.6 Multi-Disorder ICU Challenges (Shock, Burns, ARDS)
7. When to Give Bicarbonate (Therapeutic Decision Matrix)
7.1 Physiologic Role and Risks of HCO₃⁻ Administration
7.2 Indications by pH Threshold
- pH < 6.9 → Always Indicated (life-saving level)
- pH 6.9–7.1 → Consider if hemodynamically unstable
- pH > 7.1 → Usually not indicated unless shock unresponsive
7.3 Disease-Specific Rules:
- DKA: Give HCO₃⁻ only if pH < 6.9
- Lactic Acidosis: Avoid unless severe acidemia with refractory hypotension
- Renal Failure / Uremia: Indicated when HCO₃⁻ < 10 or pH < 7.1
- Hyperkalemia: Temporizing measure (shifts K⁺ intracellularly)
7.4 Infusion Protocols and Calculation
- Dose = 0.3 × Body Weight (kg) × Base Deficit
- Administer 50% initially, reassess pH in 30–60 minutes
7.5 Monitoring and Risks
- Overshoot alkalosis, CO₂ retention, ionized hypocalcemia
- Worsening intracellular acidosis if ventilation inadequate
7.6 Practical ICU Algorithm:
- Step 1: Identify reversible cause
- Step 2: Check pH threshold
- Step 3: Confirm ventilation adequacy
- Step 4: Calculate and titrate bicarbonate carefully
- Step 5: Reassess ABG and lactate within 30–60 minutes
8. Procedures & Calculators
8.1 ABG Sampling Technique (Radial, Femoral, Central Line)
8.2 Point-of-Care Analyzer Crosscheck
8.3 Formulas for Manual Calculation
8.4 Automated ICU Calculation Tools (ΔAG, Adjusted HCO₃⁻, A–a, P/F)
8.5 Stepwise Troubleshooting of Analyzer Errors
9. Checklists & Decision Algorithms
9.1 Rapid ABG Interpretation Checklist (5-Step Flow)
9.2 AG–ΔAG–Adjusted HCO₃⁻ Combined Workflow
9.3 Oxygenation Pathway (A–a + P/F Integration)
9.4 Ventilator Response Decision Tree
9.5 ABG Frequency by Clinical Condition
9.6 30-Min ICU Recheck Rules
10. Mastery Drills
10.1 Single-Disorder Simulation (10 Scenarios)
10.2 Mixed-Disorder Simulation (15 Scenarios)
10.3 ICU Crisis Patterns (Shock, Arrest, Multi-System Failure)
10.4 ABG Pattern Quiz: “Name That Disorder”
10.5 15 High-Difficulty MCQs with Detailed Explanations
11. Final Words: From Basics to ICU Competence
11.1 Integrating ABG with Clinical Context
11.2 Linking ABG to Ventilator Management
11.3 ABG as a Dynamic Monitoring Tool, Not a Snapshot
11.4 The ICU Mindset: Interpret → Intervene → Reassess
12. Radiometer ABL800 FLEX — Parameter Reference & Meaning Guide
13. References
Peer-reviewed journals, textbook cross-validation, and global ICU protocols.
1. Foundations of ABG Analysis
(Built for ICU teaching and critical care precision — easy to copy into your guide or slides)
1.1 Core Definitions and Concepts
Arterial Blood Gas (ABG):
A laboratory test that measures the partial pressures of oxygen (PaO₂) and carbon dioxide (PaCO₂), pH, bicarbonate (HCO₃⁻), and oxygen saturation (SaO₂).
It provides an immediate assessment of respiratory function, oxygenation, and acid–base balance.
Key Parameters:
-
pH: Reflects hydrogen ion concentration and acid–base status.
-
PaCO₂: Indicator of alveolar ventilation and respiratory component.
-
HCO₃⁻: Reflects metabolic (renal) contribution.
-
PaO₂: Reflects oxygen exchange at the alveolar–capillary level.
-
SaO₂: Percentage of hemoglobin bound to oxygen.
-
Base Excess (BE): Represents overall buffering status of blood.
Why ABG matters:
It’s not just a diagnostic test — it’s a dynamic monitoring tool guiding ventilation, perfusion, and resuscitation strategies in ICU and perioperative settings.
ICU Application Notes:
-
Always interpret ABG in clinical context: ventilation, perfusion, and metabolism are inseparable.
-
Never interpret pH alone — always link pH ↔ PaCO₂ ↔ HCO₃⁻.
1.2 The Four Primary Acid–Base Disorders
| Disorder | Primary Change | Compensation | Typical Causes |
|---|---|---|---|
| Metabolic Acidosis | ↓ HCO₃⁻ | ↓ PaCO₂ (hyperventilation) | DKA, lactic acidosis, renal failure, diarrhea |
| Metabolic Alkalosis | ↑ HCO₃⁻ | ↑ PaCO₂ (hypoventilation) | Vomiting, diuretics, post-hypercapnia, NG suction |
| Respiratory Acidosis | ↑ PaCO₂ | ↑ HCO₃⁻ (renal retention) | COPD, airway obstruction, CNS depression |
| Respiratory Alkalosis | ↓ PaCO₂ | ↓ HCO₃⁻ (renal excretion) | Anxiety, pain, hypoxia, sepsis, mechanical overventilation |
ICU Application Notes:
-
Metabolic disorders reflect renal or tissue metabolism.
-
Respiratory disorders reflect ventilatory mechanics or CNS control.
-
Compensation never overshoots — if it appears excessive → mixed disorder.
1.3 The Henderson–Hasselbalch Equation (Applied Physiology)
pH = 6.1 + log( [HCO3-] / (0.03 × PaCO2) )
Meaning:
Defines pH as the logarithmic ratio of base (HCO₃⁻) to acid (CO₂).
The equation is the physiologic foundation of all acid–base interpretation.
Clinical Interpretation:
-
If HCO₃⁻ ↓ → pH ↓ → metabolic acidosis
-
If HCO₃⁻ ↑ → pH ↑ → metabolic alkalosis
-
If PaCO₂ ↑ → pH ↓ → respiratory acidosis
-
If PaCO₂ ↓ → pH ↑ → respiratory alkalosis
Normal relationship:
HCO₃⁻ ≈ 24 mEq/L and PaCO₂ ≈ 40 mmHg → ratio 20:1 → pH ≈ 7.40
ICU Application Notes:
-
When pH ≠ expected for given ratio → consider mixed disorder.
-
Always evaluate both numerator (HCO₃⁻) and denominator (PaCO₂) changes together.
1.4 pH as a Ratio: The 20:1 Principle
Concept:
Blood pH is stable (~7.4) only when [HCO₃⁻] : (0.03 × PaCO₂) ≈ 20 : 1.
Clinical Meaning:
-
Any deviation from this ratio alters pH.
-
Compensation aims to restore this ratio, not normalize each component.
Example:
If HCO₃⁻ = 12 mEq/L (↓ by half), pH will remain near 7.4 only if PaCO₂ also ↓ by half (≈ 20 mmHg).
ICU Application Notes:
-
This ratio-centered thinking prevents misclassification of mixed disorders.
-
The ratio, not absolute numbers, dictates pH stability.
1.5 Blood Gas Sampling, Handling, and Common Artifacts
Sampling Technique:
-
Preferred site: Radial artery (Allen’s test mandatory).
-
Alternatives: femoral, brachial, or central line sampling (for unstable patients).
-
Use heparinized syringe and avoid air bubbles.
Handling:
-
Analyze within 10–15 minutes of collection.
-
If delay >15 min: place sample on ice (prevents metabolism-related pH drift).
-
Avoid exposure to air — causes PaO₂ ↑, PaCO₂ ↓, pH ↑ artifact.
Common Artifacts and Causes:
| Artifact | Mechanism | Resulting Error |
|---|---|---|
| Air bubble | Diffusion of gases | ↑ PaO₂, ↓ PaCO₂ |
| Delayed analysis | Ongoing RBC metabolism | ↓ pH, ↑ PaCO₂, ↓ PaO₂ |
| Excess heparin | Dilutional artifact | ↓ HCO₃⁻, ↓ pH |
| Venous sample mislabelled | Higher CO₂, lower O₂ | Appears as respiratory acidosis |
ICU Application Notes:
-
Always confirm sample integrity when ABG conflicts with patient condition.
-
Label time of draw and analyze promptly — accuracy declines sharply after 20 min at room temperature.
1.6 Normal Ranges and Clinical Thresholds
| Parameter | Normal Range | Critical Thresholds | Clinical Interpretation |
|---|---|---|---|
| pH | 7.35 – 7.45 | <7.20 (severe acidemia), >7.60 (severe alkalemia) | Life-threatening if <7.0 or >7.7 |
| PaCO₂ | 35 – 45 mmHg | <25 or >60 | <35 → hyperventilation; >45 → hypoventilation |
| HCO₃⁻ | 22 – 26 mEq/L | <10 or >40 | <18 → metabolic acidosis; >30 → metabolic alkalosis |
| PaO₂ (room air) | 80 – 100 mmHg | <60 = hypoxemia | <40 = critical tissue hypoxia |
| SaO₂ | 95 – 100% | <90% = hypoxemia | <80% = critical |
| Base Excess (BE) | −2 to +2 mEq/L | <−5 or >+5 | Quantifies total metabolic deviation |
ICU Application Notes:
-
pH <7.20 = threshold for intervention (ventilation, HCO₃⁻, or dialysis).
-
Always interpret oxygenation in context of FiO₂ and ventilation status.
-
Use trend, not single value, for dynamic decisions.
Ref Key: NEJM 2023, JAMA Critical Care 2022, Surviving Sepsis Campaign 2023, KDIGO 2021, ATS/ERS ABG Standards 2022, Oxford Critical Care 2023.
2. Rapid Recognition (Bedside Patterning)
2.1 The Five-Step ABG Interpretation Algorithm
Purpose:
To translate numbers into physiology within 30 seconds.
Step 1 — Check pH:
-
pH < 7.35 → Acidemia
-
pH > 7.45 → Alkalemia
-
pH normal → may be mixed disorder (opposing forces)
Step 2 — Determine Primary Change:
-
If PaCO₂ moves opposite direction of pH → respiratory.
-
If HCO₃⁻ moves same direction as pH → metabolic.
Step 3 — Assess Compensation (using formulas):
Compare actual vs expected PaCO₂ or HCO₃⁻ response.
If outside expected range → mixed process.
Step 4 — Evaluate Anion Gap and ΔGap (if metabolic acidosis):
Detect unmeasured anions or hidden dual disorders.
Step 5 — Review Oxygenation Status:
PaO₂ and P/F ratio define hypoxemia and ARDS severity.
ICU Application Notes:
Memorize these five steps for rapid rounds. Do not skip Step 5 — ventilation without oxygenation assessment is dangerous.
2.2 Quick Pattern Recognition in <10 Seconds
Visual Clues:
| pH | PaCO₂ | HCO₃⁻ | Likely Diagnosis |
|---|---|---|---|
| ↓ | ↑ | N / ↑ | Respiratory acidosis |
| ↓ | ↓ | ↓ | Metabolic acidosis |
| ↑ | ↓ | N / ↓ | Respiratory alkalosis |
| ↑ | ↑ | ↑ | Metabolic alkalosis |
| Normal | both abnormal in same direction | Mixed disorder |
Shortcut Tip:
“Arrows match → Metabolic; Arrows oppose → Respiratory.”
ICU Application Notes:
Keep this grid laminated on ventilator monitors. It lets you label the disorder in seconds before compensation calculation.
2.3 Acute vs Chronic Respiratory Distinction
Why it matters:
Kidney compensation is time-dependent (1 vs 4 mEq HCO₃⁻ per 10 mmHg PaCO₂).
| Disorder | Acute Change | Chronic Change | pH Impact |
|---|---|---|---|
| Resp Acidosis | +10 PaCO₂ → +1 HCO₃⁻ | +10 PaCO₂ → +4 HCO₃⁻ | pH ↓ 0.08 (acute) / 0.03 (chronic) |
| Resp Alkalosis | −10 PaCO₂ → −2 HCO₃⁻ | −10 PaCO₂ → −4 HCO₃⁻ | pH ↑ 0.08 (acute) / 0.03 (chronic) |
Clinical Clue:
If pH nearly normal but PaCO₂ extreme → chronic.
If pH grossly abnormal → acute event (superimposed on chronic base).
ICU Application Notes:
Re-sample after ventilator adjustment within 30 min to confirm trend direction (renal adaptation vs ventilatory event).
2.4 Mixed Disorder Clues from pH–PaCO₂–HCO₃⁻ Alignment
Rules to Suspect a Mixed Disorder:
-
pH normal but PaCO₂ and HCO₃⁻ both abnormal in same direction.
-
pH extreme but only one variable mildly abnormal.
-
Compensation beyond expected formulas (over- or under-compensation).
-
Anion Gap normal yet HCO₃⁻ very low → dual non-gap and gap acidosis.
ICU Application Notes:
Mixed patterns are common in ICU (esp. DKA + resp failure, COPD + diuretics, sepsis + ventilation).
Never trust “normal pH” alone — it may hide dangerous offsetting disorders.
2.5 The “Mirror Rule” for Compensatory Direction
Concept:
In compensation, the secondary variable moves in the same direction as the primary change in pH.
-
Metabolic acidosis (↓ pH) → ↓ PaCO₂ (resp alkalosis compensates)
-
Metabolic alkalosis (↑ pH) → ↑ PaCO₂ (resp acidosis compensates)
-
Respiratory acidosis (↓ pH) → ↑ HCO₃⁻ (renal retention)
-
Respiratory alkalosis (↑ pH) → ↓ HCO₃⁻ (renal excretion)
Mnemonic: “The body mirrors the direction of pH change with the opposite system.”
ICU Application Notes:
If the “mirror” fails (i.e., secondary variable moves wrong way), you are dealing with a mixed disorder.
2.6 ABG Pitfalls and ICU Traps
| Pitfall | Description | Consequence | Prevention |
|---|---|---|---|
| O₂ Bleed | Excess O₂ in sampling line | False ↑ PaO₂ / ↓ PaCO₂ | Flush line and waste 2–3 mL before sampling |
| Over-ventilation | High RR or tidal volume | Respiratory alkalosis → vasoconstriction, ↓ cerebral flow | Monitor ETCO₂ and adjust minute ventilation |
| Air Bubbles | Gas diffusion into sample | ↑ PaO₂, ↓ PaCO₂, ↑ pH | Expel bubbles immediately after draw |
| Venous Sample Mislabelled | Low O₂, high CO₂ confused for resp acidosis | Misdiagnosis → inappropriate intubation | Confirm color and pressure of draw |
| Excess Heparin | Dilutes plasma bicarbonate | ↓ HCO₃⁻, ↓ pH | Use balanced heparin syringe only |
| Delay >15 min | Ongoing cellular metabolism | ↑ PaCO₂, ↓ pH and PaO₂ | Analyze within 10 min or ice sample |
ICU Application Notes:
Before interpreting “weird” ABG values, rule out technical error. Clinical judgment must always override numbers that don’t fit the patient’s presentation.
Ref Key: UpToDate 2024, NEJM 2023, SCCM Critical Care 2022, ATS/ERS Guidelines 2022, Oxford Critical Care 2023.
3. Essential Interpretation Tools
3.1 Henderson–Hasselbalch Equation (Expanded Application)
pH = 6.1 + log( [HCO3-] / (0.03 × PaCO2) )
Concept:
Defines blood pH as the logarithmic ratio between metabolic (bicarbonate) and respiratory (carbonic acid → CO₂) components.
pH rises when the ratio > 20 : 1 and falls when < 20 : 1.
Normal set-point: HCO3- ≈ 24 mEq/L and PaCO2 ≈ 40 mmHg → pH ≈ 7.40.
Clinical Application:
-
Primary metabolic disorders change the numerator (HCO₃⁻).
-
Primary respiratory disorders change the denominator (PaCO₂).
-
pH normal but both abnormal → mixed disorder.
ICU Notes:
-
Always verify pH–HCO₃⁻–PaCO₂ alignment.
-
pH < 7.2 = threshold for ventilatory or bicarbonate intervention.
-
When pH and PaCO₂ move in opposite directions, the primary problem is respiratory.
3.2 Anion Gap (AG) and Albumin Correction
AG = [Na+] − ( [Cl-] + [HCO3-] )
Normal Range: 8 – 12 mEq/L (at albumin 4 g/dL)
Albumin Correction:
Corrected AG = AG + 2.5 × (4.0 − Albumin [g/dL])
Interpretation:
-
High AG Metabolic Acidosis: Excess unmeasured anions (lactate, ketones, uremic acids, toxins).
-
Normal AG Acidosis: Bicarbonate loss (diarrhea, RTA, saline infusion).
-
Low AG: Lab error or hypoalbuminemia.
ICU Notes:
-
Correct AG for albumin in critically ill (hypoalbuminemia masks acidosis).
-
Every high AG requires ΔAG or Adjusted HCO₃⁻ analysis.
-
Recalculate AG after each large fluid or bicarbonate dose.
3.3 Delta Gap (ΔAG) and Triple Disorder Detection
ΔGap = (AG − 12) − (24 − HCO3-)
Purpose: Compares the change in AG to the change in HCO₃⁻ to unmask hidden acid–base processes.
Interpretation:
-
ΔGap ≈ 0 → Pure AG metabolic acidosis
-
ΔGap > 0 → Concurrent metabolic alkalosis
-
ΔGap < 0 → Concurrent non-gap acidosis
ICU Notes:
-
Apply only when AG > 12.
-
Essential in DKA, sepsis, renal failure, toxin ingestions.
-
Serial ΔGap tracking detects treatment overshoot (alkalosis after DKA resolution).
3.4 Adjusted Bicarbonate (Advanced HAGMA Tool)
Adjusted HCO3- = HCO3- + (AG − 12)
Interpretation:
Adjusted HCO3- < 18 → Hidden non-gap acidosis
Adjusted HCO3- 18–30 → Pure HAGMA
Adjusted HCO3- > 30 → Hidden metabolic alkalosis
Why it matters:
Stable under rapid fluid shifts and late lactate clearance, often more reliable than Δ-ratio in ICU patients.
ICU Notes:
-
Use in all high-AG acidosis cases to reveal triple disorders.
-
Repeat every 30–60 min during shock or DKA correction.
-
Guide ventilation and bicarbonate decisions based on trend, not single value.
3.5 A–a Gradient (Alveolar–Arterial Gradient)
A–a Gradient = [FiO2 × (760 − 47) − (PaCO2 ÷ 0.8)] − PaO2
Normal Range: 5–15 mmHg (young)
Age-adjusted normal: (Age ÷ 4) + 4
Interpretation:
-
High A–a: Shunt, V/Q mismatch, diffusion defect.
-
Normal A–a with hypoxia: Hypoventilation.
ICU Notes:
-
Rising A–a gradient = early ARDS marker.
-
Trend daily to track oxygenation response to PEEP and FiO₂ changes.
-
If A–a > 500 → severe intrapulmonary shunt → consider proning or recruitment.
3.6 P/F Ratio (Oxygenation Index for ARDS Grading)
P/F Ratio = PaO2 ÷ FiO2
| P/F Ratio | ARDS Severity |
|---|---|
| > 300 | Normal |
| 200 – 300 | Mild ARDS |
| 100 – 200 | Moderate ARDS |
| < 100 | Severe ARDS |
ICU Notes:
-
Central metric for ARDS staging (Berlin Definition).
-
<150 → consider proning. <100 → consider neuromuscular blockade and advanced ventilatory strategies.
-
Monitor with FiO₂ adjustments; compare P/F daily to evaluate PEEP efficacy.
3.7 Base Excess / Base Deficit (Buffer Reserve Indicator)
Definition: The amount of acid or base required to return pH to 7.40 at PaCO₂ 40 mmHg.
Normal Range: −2 to +2 mEq/L
Interpretation:
BE > +2 → Metabolic alkalosis (excess base)
BE < −2 → Metabolic acidosis (base deficit)
Clinical Meaning:
Quantifies overall buffer capacity (including non-bicarbonate systems — Hb, proteins, phosphates).
Used to estimate bicarbonate deficit in shock or massive transfusion.
ICU Notes:
-
Base Deficit > 10 = severe metabolic acidosis → consider HCO₃⁻ therapy if pH < 7.1.
-
Trend BE for lactate clearance and resuscitation endpoint validation.
-
Correlate with anion gap to distinguish metabolic vs dilutional patterns.
Ref Key: NEJM 2023; UpToDate 2024; SCCM Critical Care 2022; KDIGO 2021; ATS/ERS ABG Standards 2022; Oxford Critical Care 2023.
4. Compensation Formulas
4.1 Overview and Mechanistic Basis
Concept:
Compensation is the body’s automatic attempt to stabilize pH when one acid–base component (respiratory or metabolic) becomes abnormal.
It never overcorrects — if it seems to, a mixed disorder is present.
Key Rules:
-
Metabolic disorders → lungs adjust PaCO₂ (fast: minutes–hours).
-
Respiratory disorders → kidneys adjust HCO₃⁻ (slow: hours–days).
-
pH returns toward normal, rarely to normal.
ICU Notes:
Always verify that compensation matches physiologic expectations before altering ventilation or giving bicarbonate.
4.2 Metabolic Disorders (Winter’s & Alkalosis Formulas)
A. Metabolic Acidosis (Winter’s Formula)
Expected PaCO2 = (1.5 × HCO3-) + 8 ± 2
Interpretation:
-
Actual PaCO₂ ≈ Expected → appropriate compensation.
-
Actual PaCO₂ > Expected → superimposed resp acidosis.
-
Actual PaCO₂ < Expected → superimposed resp alkalosis.
ICU Notes:
-
Apply when HCO₃⁻ < 22 mEq/L.
-
Recalculate after each ventilator or bicarbonate adjustment.
-
Recheck ABG every 30–60 min in DKA or shock resuscitation.
B. Metabolic Alkalosis
Expected PaCO2 = (0.7 × ΔHCO3-) + 40 ± 2
where ΔHCO₃⁻ = (measured HCO₃⁻ − 24)
Interpretation:
-
Actual ≈ Expected → appropriate compensation.
-
Lower → resp alkalosis.
-
Higher → resp acidosis.
ICU Notes:
-
Incomplete if hypoventilation limited by hypoxia.
-
Common causes: vomiting, diuretics, post-hypercapnia.
-
Never force compensation with high PaCO₂ in ventilated patients — risk of hypoxemia.
4.3 Respiratory Disorders (Acute vs Chronic Rules)
Kidneys modify HCO₃⁻ slowly; therefore, time course defines “acute” vs “chronic.”
| Disorder | Expected ΔHCO₃⁻ per 10 mmHg PaCO₂ change | pH change per 10 mmHg PaCO₂ change | Typical Context |
|---|---|---|---|
| Acute Resp Acidosis | +1 mEq/L | ↓ 0.08 | CNS depression, airway obstruction |
| Chronic Resp Acidosis | +4 mEq/L | ↓ 0.03 | COPD, OHS, neuromuscular disease |
| Acute Resp Alkalosis | −2 mEq/L | ↑ 0.08 | Pain, anxiety, sepsis, ventilation |
| Chronic Resp Alkalosis | −4 to −5 mEq/L | ↑ 0.03 | High altitude, pregnancy, liver failure |
ICU Notes:
-
If HCO₃⁻ exceeds expected range → mixed metabolic alkalosis.
-
If less than expected → mixed metabolic acidosis.
-
Repeat ABG 2–4 h after ventilator adjustment to confirm renal trend.
4.4 Compensation Summary Table
| Primary Disorder | Expected Compensation Formula | Time to Response | Clinical Clue for Mixed State |
|---|---|---|---|
| Metabolic Acidosis | PaCO₂ = (1.5 × HCO₃⁻) + 8 ± 2 | Minutes–hours | PaCO₂ > expected → resp failure |
| Metabolic Alkalosis | PaCO₂ = (0.7 × ΔHCO₃⁻) + 40 ± 2 | Minutes–hours | PaCO₂ < expected → resp alkalosis |
| Acute Resp Acidosis | ↑HCO₃⁻ ≈ +1 / +10 PaCO₂ | Minutes–hours | HCO₃⁻ > +1 → mixed alkalosis |
| Chronic Resp Acidosis | ↑HCO₃⁻ ≈ +4 / +10 PaCO₂ | ≥ 3–5 days | pH near normal with very high CO₂ |
| Acute Resp Alkalosis | ↓HCO₃⁻ ≈ −2 / −10 PaCO₂ | Minutes–hours | Incomplete drop → mixed alkalosis |
| Chronic Resp Alkalosis | ↓HCO₃⁻ ≈ −4 to −5 / −10 PaCO₂ | ≥ 2–5 days | Persistent high pH despite renal loss |
4.5 Recognizing Inappropriate or Overcompensation
Indicators of Inappropriate Response:
-
Deviation beyond expected formula range.
-
pH normal but PaCO₂ and HCO₃⁻ both abnormal in same direction.
-
“Overcorrection” — physiologically impossible; always a second disorder.
-
Respiratory component moving opposite to expected direction.
ICU Notes:
-
Overcompensation = mixed state until proven otherwise.
-
Common example: DKA on ventilator with PaCO₂ < expected → added resp alkalosis from sepsis.
4.6 Practical ICU Algorithm for Expected vs Actual Values
Step 1: Identify primary disorder by pH direction.
Step 2: Apply correct compensation formula.
Step 3: Compare actual PaCO₂ or HCO₃⁻ to expected.
Step 4: Decide if compensation is appropriate or mixed.
Step 5: Adjust ventilator or metabolic support accordingly.
Example:
pH 7.25, HCO₃⁻ 14, PaCO₂ 27 → Expected PaCO₂ (1.5×14)+8 = 29 ± 2 → appropriate resp compensation.
ICU Notes:
-
Use serial ABGs to verify trend direction, not just snapshot.
-
Physiologic compensation ends where mechanical ventilation or drug therapy interferes.
-
Document “expected vs actual” on chart for each acid–base change.
Ref Key: UpToDate 2024; NEJM 2023; SCCM Critical Care 2022; ATS/ERS Guidelines 2022; Oxford Critical Care 2023.
5. Mixed Disorder Recognition & Rapid Interpretation
5.1 How to Identify Mixed Disorders at a Glance
Definition:
A mixed disorder occurs when two or more primary acid–base abnormalities coexist in the same patient.
The hallmark is a mismatch between pH, PaCO₂, and HCO₃⁻ that cannot be explained by one physiologic process or its expected compensation.
Recognition Rules:
-
pH direction conflicts with component changes.
-
Example: pH ↓ but both PaCO₂ and HCO₃⁻ ↓ → metabolic and respiratory acidosis combined.
-
-
Compensation exceeds physiologic limits.
-
Over- or under-compensation = mixed process.
-
-
pH nearly normal yet both PaCO₂ and HCO₃⁻ abnormal in same direction.
-
“Neutralized pH” does not mean normal physiology.
-
-
ΔGap or Adjusted HCO₃⁻ reveals hidden processes.
ICU Application Notes:
-
Mixed disorders are expected, not rare, in critical care — think multi-organ failure, ventilated diabetics, or shock on diuretics.
-
Always interpret trend, not snapshot.
-
When in doubt, calculate compensation and AG together; discordance = mixed pattern.
5.2 The “Normal pH Paradox” and Hidden Dual Shifts
Concept:
A normal pH (7.35–7.45) may conceal opposing acid–base processes:
-
Metabolic acidosis + respiratory alkalosis (most common ICU pair).
-
Metabolic alkalosis + respiratory acidosis (e.g., COPD with diuretics).
Examples:
-
Sepsis: Lactic acidosis with hyperventilation → pH normal.
-
COPD on furosemide: CO₂ retention + metabolic alkalosis → normal pH.
ICU Teaching Pearl:
“Normal pH in a sick patient means two fires burning in opposite directions.”
Verification:
Use expected-PaCO₂ or expected-HCO₃⁻ formulas; if both sides deviate, dual process confirmed.
5.3 Stepwise Approach for Overlapping Patterns
Step 1: Identify pH direction (acidic / alkaline / normal).
Step 2: Determine which component (PaCO₂ or HCO₃⁻) moves in same direction as pH → primary disorder.
Step 3: Apply appropriate compensation rule.
Step 4: Compare actual vs expected.
- If outside predicted range → secondary process present.
Step 5: Compute AG and ΔGap (if AG >12).
Step 6: Re-evaluate adjusted HCO₃⁻ for triple pattern check.
ICU Shortcut:
Use the “5-Line Rule” on scratchpad or ventilator:
pH →
PaCO2 →
HCO3- →
AG →
Expected PaCO2 (or HCO3-) →
The mismatch line identifies the mixed process.
ICU Application Notes:
Reassess ABG every 30–60 min in unstable patients or when correcting ventilation, fluids, or DKA.
5.4 Triple Disorders and the Adjusted HCO₃⁻ Method
Why It Matters:
Triple disorders (three simultaneous processes) occur commonly in the ICU — e.g., metabolic acidosis from sepsis + metabolic alkalosis from diuretics + respiratory failure.
Tool: Adjusted Bicarbonate Formula
Adjusted HCO3- = HCO3- + (AG − 12)
Interpretation:
-
Adjusted HCO₃⁻ <18 → hidden non-gap acidosis.
-
18–30 → pure HAGMA.
-
30 → concurrent metabolic alkalosis.
Clinical Example:
pH 7.32, HCO₃⁻ 12, AG 28 → Adjusted HCO₃⁻ = 12 + (28−12) = 28 → dual acidosis + metabolic alkalosis (triple disorder).
ICU Application Notes:
-
Compute Adjusted HCO₃⁻ in every AG >12 case.
-
Serial tracking distinguishes physiologic correction from overshoot.
-
Particularly valuable in DKA, renal replacement therapy, or multi-day ventilation.
5.5 Case Table: DKA + Sepsis, COPD + Diuretics, ASA Toxicity
| Case | ABG Pattern | Interpretation | Key ICU Action |
|---|---|---|---|
| DKA + Sepsis | ↓ pH, ↓ HCO₃⁻, ↓ PaCO₂ (excessive) | Metabolic acidosis + resp alkalosis | Manage sepsis first; avoid over-ventilation; check lactate & ΔGap |
| COPD + Diuretics | ↑ pH, ↑ HCO₃⁻, ↑ PaCO₂ | Resp acidosis + metabolic alkalosis | Correct volume + K⁺ before fixing ventilation |
| ASA Toxicity | ↓ pH, ↓ PaCO₂, ↓ HCO₃⁻ | Mixed metabolic + resp alkalosis | Early intubation may worsen acidosis — caution |
| Renal Failure + Shock | ↓ pH, ↓ HCO₃⁻, ↑ PaCO₂ | Combined metabolic + resp acidosis | Start dialysis or buffer if pH <7.1 |
| Ventilated DKA Recovery | ↑ pH, ↑ HCO₃⁻, ↓ PaCO₂ | Post-therapy rebound alkalosis | Reduce insulin drip; titrate ventilator |
ICU Application Notes:
Use the ΔGap–Adjusted HCO₃⁻ combo to verify all mixed and triple processes before initiating bicarbonate or dialysis.
5.6 ICU Frequency Rule: When to Recheck ABG in Mixed States
| Situation | Recommended ABG Recheck Interval | Rationale |
|---|---|---|
| DKA, septic shock, severe lactic acidosis | Every 30–60 min until pH >7.25 | Detect rebound or dual pattern evolution |
| Ventilator change (acute resp event) | 15–30 min post-adjustment | Confirm compensation trajectory |
| Renal replacement therapy start/stop | 30–60 min | Monitor buffer and CO₂ handling |
| Post-bicarbonate or large fluid bolus | 30 min | Avoid overshoot alkalosis |
| Mixed chronic–acute COPD exacerbation | 1–2 h | Track CO₂ retention vs correction |
ICU Teaching Pearl:
“ABG is not a lab — it’s a live monitor. Frequency depends on instability, not protocol.”
Ref Key: UpToDate 2024; NEJM 2023; SCCM Critical Care 2022; KDIGO 2021; ATS/ERS Standards 2022; Oxford Critical Care 2023.
6. Case-Based Learning: Real-World Scenarios
6.1 DKA and Lactic Acidosis: Dual Acid Profiles
Scenario:
A 45-year-old diabetic presents with sepsis and hypotension. ABG: pH 7.08 / PaCO₂ 22 / HCO₃⁻ 7 / Na⁺ 136 / Cl⁻ 100 / Lactate 8 mmol/L.
Analysis:
Primary = metabolic acidosis (HCO₃⁻ ↓).
Expected PaCO₂ = (1.5 × 7) + 8 ± 2 = 18–22 → appropriate compensation.
AG = 136 − (100 + 7) = 29 → high AG metabolic acidosis.
ΔGap = (29−12) − (24−7) = +4 → minor metabolic alkalosis from vomiting/volume loss.
Interpretation:
Mixed high-AG acidosis (DKA + lactate) with mild secondary alkalosis.
ICU Application Notes:
-
Treat source (antibiotics + fluids + insulin drip).
-
Avoid bicarbonate unless pH < 6.9 or refractory shock.
-
Recheck AG and lactate q30–60 min for resolution trend.
6.2 COPD with Sepsis: Mixed Chronic–Acute Disorder
Scenario:
A 70-year-old COPD patient on home O₂ develops pneumonia. ABG: pH 7.24 / PaCO₂ 70 / HCO₃⁻ 30.
Analysis:
Baseline (chronic retainer): PaCO₂ 55 / HCO₃⁻ 30 / pH 7.36.
Now PaCO₂ 70 → +15 rise. Expected ΔHCO₃⁻ ≈ +6 (chronic 4 per 10) → 36 expected, actual 30 → metabolic acidosis added (sepsis lactate).
Interpretation:
Acute-on-chronic resp acidosis + metabolic acidosis → mixed disorder.
ICU Application Notes:
-
Intubate early if fatigued.
-
Do not normalize PaCO₂ rapidly → post-hypercapnic alkalosis risk.
-
Target pH > 7.25 initially; reassess HCO₃⁻ daily.
6.3 Post-Hypercapnic Alkalosis in the Ventilated Patient
Scenario:
A COPD patient intubated for CO₂ retention (pH 7.20 / PaCO₂ 80 / HCO₃⁻ 35). After over-ventilation, ABG: pH 7.55 / PaCO₂ 30 / HCO₃⁻ 26.
Analysis:
Rapid PaCO₂ drop from 80 → 30 (−50). Kidneys still retain HCO₃⁻ (high), causing acute alkalemia.
Interpretation:
Post-hypercapnic metabolic alkalosis due to renal HCO₃⁻ retention lagging behind CO₂ correction.
ICU Application Notes:
-
Correct slowly; return PaCO₂ toward baseline (50–55).
-
Monitor for arrhythmia and hypokalemia.
-
May require acetazolamide if pH > 7.55 and symptomatic.
6.4 Renal Failure with Bicarbonate Retention
Scenario:
Patient with CKD on diuretics. ABG: pH 7.48 / PaCO₂ 50 / HCO₃⁻ 36.
Analysis:
↑ HCO₃⁻ → primary metabolic alkalosis. Expected PaCO₂ = (0.7 × 12)+40 = 48. Actual 50 ≈ appropriate.
Interpretation:
Metabolic alkalosis from volume depletion and H⁺ loss (post-diuretic) with CKD reducing acid excretion.
ICU Application Notes:
-
Restore chloride and volume (NS + KCl).
-
Hold loop diuretics until pH < 7.45.
-
Dialysis if uremic toxins coexist or pH > 7.55 with symptoms.
6.5 Acute Pulmonary Embolism with Normal ABG Appearance
Scenario:
A 40-year-old woman with sudden dyspnea. ABG: pH 7.44 / PaCO₂ 34 / HCO₃⁻ 22 / PaO₂ 62 on room air.
Analysis:
Resp alkalosis from hyperventilation. A–a gradient = (0.21×713 − (34 ÷ 0.8)) − 62 ≈ 38 → elevated for age (should be ~14).
Interpretation:
Early PE causing V/Q mismatch with hyperventilation keeping pH near normal.
ICU Application Notes:
-
A–a gradient more sensitive than PaO₂ alone.
-
Repeat ABG and D-dimer if hypoxia disproportionate to CXR.
-
Early O₂ and anticoagulation critical; avoid delays for “normal” pH.
6.6 Multi-Disorder ICU Challenges (Shock, Burns, ARDS)
Scenario:
A burn patient in septic shock on high FiO₂. ABG: pH 7.22 / PaCO₂ 50 / HCO₃⁻ 20 / PaO₂ 58 on FiO₂ 0.6.
Analysis:
-
pH ↓ → acidemia.
-
PaCO₂ ↑ → resp acidosis component.
-
HCO₃⁻ ↓ → metabolic acidosis.
-
P/F = 58 ÷ 0.6 = 97 → severe ARDS.
→ Combined metabolic + respiratory acidosis with hypoxic failure.
ICU Application Notes:
-
Optimize ventilation (ARDSNet low-Vt, PEEP strategy).
-
Begin vasopressors + fluids; correct lactate source.
-
Consider bicarbonate only if pH < 7.1 and CO₂ removal adequate.
-
Recheck ABG and lactate every 30–45 min until pH > 7.25.
Ref Key: UpToDate 2024; NEJM 2023; SCCM Critical Care 2022; KDIGO 2021; ATS/ERS 2022; Oxford Critical Care 2023.
7. When to Give Bicarbonate (Therapeutic Decision Matrix)
7.1 Physiologic Role and Risks of HCO₃⁻ Administration
Physiology:
Bicarbonate (HCO₃⁻) acts as the primary extracellular buffer, combining with hydrogen ions to form carbonic acid, which dissociates into CO₂ and water:
H⁺ + HCO3⁻ → H2CO3 → CO2 + H2O
This process neutralizes acid but generates additional CO₂, which must be exhaled via the lungs.
Therefore, effective bicarbonate therapy requires adequate ventilation.
Purpose:
-
Temporarily raise pH in life-threatening acidemia (<7.1).
-
Protect myocardial contractility and catecholamine response until the primary cause is reversed.
Risks:
-
Rapid CO₂ generation → intracellular acidosis if ventilation inadequate.
-
Ionized hypocalcemia → arrhythmias, hypotension.
-
Sodium overload and hyperosmolarity.
-
Paradoxical CNS acidosis (CO₂ diffuses across BBB faster than HCO₃⁻).
ICU Application Notes:
Use bicarbonate only as a physiologic bridge — not a fix. Always correct the cause (shock, sepsis, renal failure, hypoventilation).
7.2 Indications by pH Threshold
| pH Level | Indication | Clinical Action |
|---|---|---|
| < 6.9 | Always indicated (life-saving) | Immediate IV HCO₃⁻ while correcting cause |
| 6.9 – 7.1 | Consider if hemodynamically unstable or catecholamine-resistant shock | Give cautious bolus and reassess ABG |
| > 7.1 | Usually not indicated unless shock refractory to fluids/pressors | Focus on treating underlying disorder |
ICU Teaching Pearl:
The lower the pH, the more bicarbonate acts as a temporizing buffer rather than a cure.
7.3 Disease-Specific Rules
A. Diabetic Ketoacidosis (DKA)
-
Pathophysiology: ketoacid buildup; CO₂ removal intact if ventilation adequate.
-
Guideline: Give HCO₃⁻ only if pH < 6.9.
-
Dose: 100 mEq in 400 mL sterile water with 20 mEq KCl over 2 h.
-
Repeat if pH < 7.0 after 2 h.
-
Rationale: Bicarbonate may delay ketone clearance and increase CO₂ load.
B. Lactic Acidosis
-
Generated from tissue hypoxia or shock; CO₂ produced exceeds buffer capacity.
-
Avoid unless severe acidemia with refractory hypotension (pH < 7.0).
-
Priority: restore perfusion and oxygen delivery.
-
If used, ensure PaCO₂ ≤ 40 mmHg (adequate ventilation).
C. Renal Failure / Uremia
-
Accumulated fixed acids + impaired excretion.
-
Indicated when: HCO₃⁻ < 10 mEq/L or pH < 7.1.
-
Oral or IV replacement may stabilize until dialysis available.
-
In CRRT, aim for plasma HCO₃⁻ 18–22 mEq/L.
D. Hyperkalemia
-
Bicarbonate drives K⁺ intracellularly by shifting H⁺ out of cells.
-
Use as temporizing measure only (15–20 min onset).
-
Combine with insulin + glucose and calcium gluconate.
ICU Application Notes:
Always ventilate aggressively when giving HCO₃⁻ to hypercapnic or renal patients to avoid rebound acidosis.
7.4 Infusion Protocols and Calculation
Standard Formula:
Bicarbonate Dose (mEq) = 0.3 × Body Weight (kg) × Base Deficit
Administration:
-
Give 50 % of calculated dose initially.
-
Reassess pH and PaCO₂ in 30–60 min.
-
Remaining dose titrated based on updated ABG.
-
For continuous infusion: mix 150 mEq NaHCO₃⁻ in 1 L D5W; infuse 250 mL/hr and adjust to maintain pH 7.20–7.25.
Example:
70 kg patient, BE = −10 → 0.3 × 70 × 10 = 210 mEq → give 100 mEq over 1 h, recheck ABG.
ICU Application Notes:
Never chase pH > 7.3; overshoot alkalosis impairs oxygen release (left shift of Hb curve).
7.5 Monitoring and Risks
| Complication | Mechanism | Prevention / Action |
|---|---|---|
| Overshoot Alkalosis | Over-replacement of base | Stop infusion if pH > 7.45 |
| CO₂ Retention | CO₂ generated faster than exhaled | Ensure adequate ventilation / adjust minute ventilation |
| Ionized Hypocalcemia | Alkalosis increases Ca²⁺ binding to albumin | Monitor ionized Ca²⁺, give Ca-gluconate if hypotensive |
| Sodium Overload / Volume Expansion | High Na⁺ content (1 mEq = 1 mEq Na⁺) | Use isotonic or balanced solutions; watch CHF patients |
| Paradoxical Intracellular Acidosis | CO₂ diffuses into cells | Only treat if ventilation sufficient |
ICU Application Notes:
Reassess electrolytes, ionized Ca²⁺, and lactate after every bicarbonate round.
7.6 Practical ICU Algorithm
Step 1: Identify and treat the reversible cause (shock, DKA, sepsis, renal failure).
Step 2: Check pH threshold and hemodynamic stability.
Step 3: Confirm ventilation adequacy (PaCO₂ ≤ 40).
Step 4: Calculate bicarbonate dose using base deficit formula.
Step 5: Administer 50 % of dose; reassess ABG and lactate in 30–60 min.
Step 6: Adjust infusion or initiate dialysis if no pH improvement.
Teaching Pearl:
“If you can’t blow off the CO₂ you create, you’ll drown in the buffer you gave.”
Ref Key: NEJM 2023; UpToDate 2024; SCCM Critical Care 2022; KDIGO 2021; Surviving Sepsis 2023; Oxford Critical Care 2023.
8. Procedures & Calculators
8.1 ABG Sampling Technique (Radial, Femoral, Central Line)
Purpose:
Accurate sampling is the foundation of valid interpretation. Even perfect analysis is meaningless if the sample is contaminated, delayed, or drawn incorrectly.
Preparation:
-
Confirm patient identity and FiO₂ setting.
-
Heparinize syringe (balanced or dry-heparin type).
-
Remove all air bubbles before draw.
-
Waste the first 2–3 mL if line-drawn to avoid flush solution contamination.
Radial Artery (Preferred Site)
-
Perform Allen test – ensure collateral ulnar flow.
-
Use 23–25 G needle at 45° angle.
-
Allow syringe to fill spontaneously; avoid aspiration.
-
Apply firm pressure for ≥ 5 min after draw.
Femoral Artery (Shock or Low Flow States)
-
Use 22 G, 90° entry.
-
High infection risk—strict asepsis.
-
Short transport time (< 5 min).
Central Line or Arterial Catheter
-
Waste 2–3 mL before sampling.
-
Label clearly as arterial vs venous.
Handling:
-
Analyze within 10 min; if delayed, place on ice slurry (4 °C).
-
Mix gently to prevent clotting.
ICU Application Notes:
Arterial site choice impacts accuracy—radial is best for trend monitoring, femoral for unstable or high-dose pressor patients.
8.2 Point-of-Care Analyzer Crosscheck
Purpose:
Ensure machine consistency and calibration accuracy.
| Check | Frequency | Acceptable Range | Action if Out of Range |
|---|---|---|---|
| Internal 2-point calibration | Every 8 h | ± 0.02 pH, ± 3 mmHg PaCO₂/O₂ | Recalibrate or replace cartridge |
| Parallel lab verification | Weekly or after maintenance | ΔpH < 0.03, ΔPaCO₂ < 5 mmHg | Re-calibrate analyzer |
| Quality-control ampule | Daily | Within manufacturer limits | Flag and remove analyzer if deviation persists |
ICU Application Notes:
Never rely on a single analyzer for trending in shock or ARDS cases—cross-verify with central lab if ABG results contradict the clinical picture.
8.3 Formulas for Manual Calculation
Use when analyzer output incomplete or for teaching rounds.
1. Anion Gap (AG)
AG = Na+ − (Cl− + HCO3−)
2. Corrected AG (for albumin)
Corrected AG = AG + 2.5 × (4.0 − Albumin[g/dL])
3. Delta Gap (ΔAG)
ΔGap = (AG − 12) − (24 − HCO3−)
4. Adjusted Bicarbonate
Adjusted HCO3− = HCO3− + (AG − 12)
5. Alveolar–Arterial Gradient (A–a)
A–a = [FiO2 × (760 − 47) − (PaCO2 ÷ 0.8)] − PaO2
6. P/F Ratio
P/F = PaO2 ÷ FiO2
7. Base Excess Calculation (approximate)
Base Deficit ≈ 0.93 × (24 − HCO3−)
ICU Application Notes:
Keep a printed pocket card with these equations. Residents should be able to calculate AG, ΔAG, and P/F manually in under 60 seconds.
8.4 Automated ICU Calculation Tools (ΔAG, Adjusted HCO₃⁻, A–a, P/F)
Modern bedside analyzers (Radiometer, Abbott i-STAT, GEM Premier) automatically compute:
-
AG and corrected AG
-
ΔAG and Adjusted HCO₃⁻
-
A–a Gradient
-
P/F Ratio
-
Base Excess and Oxygen Saturation
Advantages:
-
Instant mixed-disorder detection.
-
Trend tracking over serial samples.
-
Auto-alerts for abnormal pH or AG drift.
ICU Integration:
-
Link analyzer to EMR to auto-populate ventilator and perfusion dashboards.
-
Re-validate machine formulas quarterly; confirm they use albumin-corrected AG for ICU accuracy.
ICU Application Notes:
Automation improves speed but not judgment—interpret results clinically before acting.
8.5 Stepwise Troubleshooting of Analyzer Errors
| Error Type | Cause | Correction |
|---|---|---|
| “Out-of-range pH” or negative BE | Air bubbles, heparin dilution | Re-sample; avoid excessive heparin |
| PaO₂ > 300 on room air | O₂ contamination (“O₂ bleed”) | Re-draw with new syringe; flush stopcock |
| PaCO₂ < 10 mmHg or inconsistent | Sample delay/metabolic activity | Analyze immediately or ice transport |
| Low HCO₃⁻ + normal pH | Analyzer software error | Crosscheck manually using Henderson–Hasselbalch |
| Frequent calibration failure | Sensor membrane degradation | Replace electrode cartridge |
| High lactate with normal pH | Delayed sample from tourniqueted site | Use fresh arterial site |
ICU Application Notes:
When numbers defy physiology, assume sampling or analyzer fault first. Always correlate with patient status before adjusting therapy.
Ref Key: UpToDate 2024; NEJM 2023; SCCM Critical Care 2022; ATS/ERS 2022; Oxford Critical Care 2023; KDIGO 2021.
9. Checklists & Decision Algorithms
9.1 Rapid ABG Interpretation Checklist (5-Step Flow)
Purpose: To achieve complete ABG interpretation in under 30 seconds.
Step 1 — Check pH:
-
<7.35 → acidemia
-
7.45 → alkalemia
-
Normal → possible mixed disorder
Step 2 — Identify Primary Process:
-
pH and PaCO₂ move opposite → respiratory.
-
pH and HCO₃⁻ move together → metabolic.
Step 3 — Assess Compensation:
-
Apply appropriate formula (Winter’s, respiratory rules).
-
Compare expected vs actual values.
Step 4 — Calculate Anion Gap:
AG = Na+ − (Cl− + HCO3−)
Correct for albumin.
Step 5 — Evaluate Oxygenation:
-
Calculate A–a Gradient and P/F ratio.
-
Classify ARDS if indicated.
ICU Application Notes:
Do not finalize interpretation until you’ve verified compensation.
A “normal pH” never rules out pathology — always finish the checklist.
9.2 AG–ΔAG–Adjusted HCO₃⁻ Combined Workflow
Purpose: To unmask mixed or triple acid–base disorders rapidly.
Workflow:
-
Calculate AG → identify high vs normal gap.
-
If AG > 12, calculate ΔGap:
ΔGap = (AG − 12) − (24 − HCO3−) -
Calculate Adjusted HCO₃⁻:
Adjusted HCO3− = HCO3− + (AG − 12) -
Interpret Together:
| Finding | Meaning |
|---|---|
| ΔGap ≈ 0, Adjusted HCO₃⁻ 18–30 | Pure high-AG acidosis |
| ΔGap < 0, Adjusted HCO₃⁻ <18 | Coexisting non-gap acidosis |
| ΔGap > 0, Adjusted HCO₃⁻ >30 | Coexisting metabolic alkalosis |
| AG normal, HCO₃⁻ abnormal | Pure non-gap acidosis or alkalosis |
ICU Application Notes:
Use this trio after every high-AG result — it’s the single best protection against misreading DKA, sepsis, or renal failure ABGs.
9.3 Oxygenation Pathway (A–a + P/F Integration)
Purpose: Rapid bedside grading of oxygenation failure and shunt severity.
Step 1:
Calculate A–a Gradient
A–a = [FiO2 × (760 − 47) − (PaCO2 ÷ 0.8)] − PaO2
Step 2:
Calculate P/F Ratio
P/F = PaO2 ÷ FiO2
Step 3 — Interpret:
| A–a Gradient | P/F Ratio | Clinical Meaning | Action |
|---|---|---|---|
| Normal (<15–20) | >300 | Normal oxygenation | Observe |
| Elevated (>20–30) | 200–300 | Mild shunt / early V/Q mismatch | Adjust FiO₂ / PEEP |
| Marked (>40–60) | 100–200 | Moderate shunt / ARDS | Prone, optimize PEEP |
| Very High (>500) | <100 | Severe shunt / refractory hypoxemia | Paralysis, ECMO eval |
ICU Application Notes:
Recalculate A–a and P/F after every major ventilator change.
Trends are more informative than absolute values.
9.4 Ventilator Response Decision Tree
Goal: Convert ABG results into ventilator action points.
Step 1 — pH < 7.25 (acidemia):
-
If PaCO₂ high → increase minute ventilation (↑ RR or Vt).
-
If HCO₃⁻ low → check for metabolic acidosis; adjust fluids, perfusion, or give HCO₃⁻ if pH <6.9.
Step 2 — pH > 7.45 (alkalemia):
-
If PaCO₂ low → reduce RR or tidal volume.
-
If HCO₃⁻ high → review diuretics, volume, K⁺ losses.
Step 3 — PaO₂ < 60 (hypoxemia):
-
Increase FiO₂ first, then PEEP.
-
If P/F <150 → consider prone positioning.
Step 4 — PaO₂ > 100 (hyperoxia):
-
Reduce FiO₂ to <0.6 to minimize oxygen toxicity.
ICU Application Notes:
All ventilator adjustments must be followed by repeat ABG in 15–30 min.
Avoid simultaneous changes to RR and PEEP unless in arrest or ECMO setup.
9.5 ABG Frequency by Clinical Condition
| Clinical Context | Recommended Frequency | Rationale |
|---|---|---|
| DKA / Lactic Acidosis / Septic Shock | Every 30–60 min until pH > 7.25 | Track metabolic correction and CO₂ trend |
| Post–Ventilator Change | 15–30 min | Assess new equilibrium |
| ARDS / High PEEP | 1–2 h | Monitor oxygenation and PaCO₂ drift |
| Continuous Bicarbonate or CRRT | 30–60 min | Prevent overcorrection |
| Stable Ventilated Patient | 4–6 h | Confirm ongoing stability |
| Weaning Trial | Pre- and post-spontaneous breathing | Verify gas exchange reserve |
ICU Teaching Pearl:
ABG timing follows instability, not the clock.
9.6 30-Min ICU Recheck Rules
Use when:
-
pH < 7.25 or > 7.55
-
New ventilator adjustment
-
Active HCO₃⁻ infusion or fluid resuscitation
-
Lactate > 4 mmol/L
-
New hemodynamic or neurologic deterioration
Recheck Includes:
-
ABG (pH, PaCO₂, PaO₂, HCO₃⁻)
-
Lactate and electrolytes (Na⁺, K⁺, ionized Ca²⁺)
-
FiO₂ confirmation
-
Ventilator settings verification
ICU Application Notes:
When trending, plot pH and PaCO₂ on whiteboard or EMR graph — seeing direction matters more than isolated values.
Ref Key: UpToDate 2024; NEJM 2023; SCCM 2022; ATS/ERS 2022; Oxford Critical Care 2023; Surviving Sepsis 2023; KDIGO 2021.
10. Mastery Drills
10.1 Single-Disorder Simulation (10 Scenarios)
Purpose: Reinforce recognition of pure, uncompensated or appropriately compensated disorders.
| Case | ABG (pH / PaCO₂ / HCO₃⁻) | Diagnosis | Expected Compensation | Key Teaching Point |
|---|---|---|---|---|
| 1 | 7.25 / 60 / 26 | Acute Respiratory Acidosis | None (acute) | Airway obstruction / narcotics |
| 2 | 7.55 / 25 / 22 | Acute Respiratory Alkalosis | None | Pain, anxiety, early sepsis |
| 3 | 7.30 / 25 / 12 | Metabolic Acidosis | PaCO₂ ≈ (1.5×12)+8=26 | DKA, shock, diarrhea |
| 4 | 7.48 / 48 / 35 | Metabolic Alkalosis | PaCO₂ ≈ (0.7×11)+40=48 | Diuretics, vomiting |
| 5 | 7.36 / 50 / 28 | Chronic Resp Acidosis | ΔHCO₃⁻ +4/10 PaCO₂ | COPD stable |
| 6 | 7.44 / 30 / 20 | Chronic Resp Alkalosis | ΔHCO₃⁻ −4/10 PaCO₂ | Pregnancy, cirrhosis |
| 7 | 7.10 / 70 / 21 | Combined Resp + Met Acidosis | None | Arrest, multiorgan failure |
| 8 | 7.50 / 30 / 23 | Acute Resp Alkalosis | None | Early hypoxia response |
| 9 | 7.60 / 20 / 19 | Mixed Resp + Met Alkalosis | None | Post-ventilation, loop diuretics |
| 10 | 7.20 / 80 / 32 | Post-CO₂ retention | Partial renal comp | Hypoventilation event |
ICU Application Notes:
Always verify expected compensation—if values fall outside prediction, assume a mixed process.
10.2 Mixed-Disorder Simulation (15 Scenarios)
| Case | ABG | Interpretation | Mechanism | ICU Action |
|---|---|---|---|---|
| 1 | 7.08 / 22 / 7 | DKA + Lactic Acidosis | Dual metabolic acids | Fluids + insulin + source control |
| 2 | 7.28 / 60 / 28 | COPD + Sepsis | Resp acidosis + Met acidosis | Antibiotics + adjust ventilation |
| 3 | 7.45 / 30 / 20 | DKA resolving + over-ventilation | Resp alkalosis + Met acidosis | Decrease RR |
| 4 | 7.36 / 55 / 31 | Chronic CO₂ + Met alkalosis | COPD on furosemide | Volume + KCl |
| 5 | 7.18 / 40 / 14 | Metabolic Acidosis + Normal CO₂ | Early mixed before resp comp | Recheck ABG 30 min |
| 6 | 7.40 / 50 / 30 | Masked Mixed | Neutral pH paradox | Repeat ΔGap / Adjusted HCO₃⁻ |
| 7 | 7.55 / 22 / 18 | ASA Toxicity | Resp + Met alkalosis | Activated charcoal + dialysis |
| 8 | 7.30 / 70 / 33 | Post-intubation CO₂ rise | Resp acidosis + Renal comp | Vent adjust |
| 9 | 7.25 / 20 / 8 | Early Sepsis | Resp alkalosis + Met acidosis | Fluids + culture |
| 10 | 7.48 / 60 / 45 | Post-hypercapnic rebound | Resp acidosis + Met alkalosis | Decrease HCO₃⁻ load |
| 11 | 7.33 / 60 / 30 | COPD + CHF | Mixed with hypoventilation | Diuretics + ventilatory support |
| 12 | 7.20 / 80 / 28 | Cardiac arrest | Combined severe acidosis | ACLS + bicarb if pH<6.9 |
| 13 | 7.50 / 25 / 19 | Salicylate ingestion | Dual alkalosis | Dialysis |
| 14 | 7.46 / 55 / 37 | Over-diuresis + CO₂ retention | Met + Resp alkalosis | NS + stop diuretics |
| 15 | 7.18 / 25 / 9 | Sepsis + Early vent | Met acidosis + Resp alkalosis | Adjust vent + treat cause |
ICU Application Notes:
Mixed disorders are rule, not exception. Use AG–ΔAG–Adjusted HCO₃⁻ workflow to confirm complexity.
10.3 ICU Crisis Patterns (Shock, Arrest, Multi-System Failure)
| Crisis Type | Typical ABG | Pattern | Immediate ICU Response |
|---|---|---|---|
| Septic Shock (late) | 7.10 / 30 / 9 | Mixed metabolic + resp alkalosis | Fluids, norepinephrine, correct source |
| Cardiac Arrest (peri-code) | 6.95 / 80 / 14 | Combined acidosis | Ventilate, CPR, IV NaHCO₃ if pH<6.9 |
| Massive PE | 7.44 / 28 / 19 | Resp alkalosis early, later acidosis | Thrombolysis / anticoagulation |
| Burn Shock | 7.20 / 50 / 20 | Mixed acidosis | Volume + early airway + monitor lactate |
| ARDS with Sepsis | 7.25 / 60 / 26 | Resp + Met acidosis | ARDSNet ventilation, PEEP titration |
| Severe Hypoventilation (CNS) | 7.05 / 90 / 30 | Pure resp acidosis | Intubate + reverse cause |
| Multi-organ Failure | 7.08 / 70 / 18 | Dual acidosis | CRRT + buffer + ventilatory support |
ICU Teaching Pearl:
In any crisis, interpret pH and PaCO₂ first. Correction of oxygenation and perfusion follows, not precedes, recognition.
10.4 ABG Pattern Quiz: “Name That Disorder”
| ABG (pH / PaCO₂ / HCO₃⁻) | Your Answer | Actual Diagnosis |
|---|---|---|
| 7.50 / 30 / 23 | Acute resp alkalosis | |
| 7.25 / 30 / 12 | Metabolic acidosis with resp comp | |
| 7.36 / 55 / 30 | Chronic resp acidosis | |
| 7.10 / 70 / 20 | Combined resp + metabolic acidosis | |
| 7.48 / 60 / 45 | Metabolic + resp alkalosis | |
| 7.44 / 34 / 22 | Chronic resp alkalosis | |
| 7.30 / 40 / 19 | Non-gap metabolic acidosis | |
| 7.56 / 25 / 22 | Acute resp alkalosis | |
| 7.22 / 25 / 10 | Lactic acidosis + resp alkalosis | |
| 7.40 / 50 / 30 | Neutralized mixed (normal pH paradox) |
ICU Application Notes:
Encourage trainees to verbalize the five-step logic before naming disorder — this builds reflex patterning.
10.5 15 High-Difficulty MCQs with Detailed Explanations
1. A 68-year-old COPD patient on furosemide: ABG 7.46 / 60 / 40.
→ Answer: Mixed respiratory acidosis + metabolic alkalosis.
→ Explanation: Chronic CO₂ retention with excessive diuretic alkalosis.
2. ABG 7.08 / 22 / 6, AG 32.
→ Answer: DKA + lactic acidosis (high-AG).
→ Explanation: ΔGap >0 → secondary metabolic alkalosis possible.
3. pH 7.55 / 28 / 24 after panic attack.
→ Answer: Acute respiratory alkalosis.
→ Explanation: No renal adaptation yet.
4. pH 7.28 / 60 / 27 in COPD exacerbation.
→ Answer: Acute-on-chronic respiratory acidosis.
→ Explanation: ΔHCO₃⁻ less than chronic compensation.
5. pH 7.40 / 25 / 15, AG 20.
→ Answer: Mixed metabolic acidosis + resp alkalosis.
→ Explanation: Neutral pH, both abnormal.
6. pH 7.18 / 40 / 14.
→ Answer: Early metabolic acidosis.
→ Explanation: No resp compensation yet.
7. pH 7.50 / 60 / 46.
→ Answer: Metabolic alkalosis with resp acidosis.
→ Explanation: Over-correction after diuretics.
8. pH 7.25 / 30 / 12, AG 24.
→ Answer: High-AG metabolic acidosis with resp comp.
→ Explanation: Expected PaCO₂ ≈ 26; near appropriate.
9. pH 7.32 / 50 / 26.
→ Answer: Primary resp acidosis.
→ Explanation: No metabolic disturbance.
10. pH 7.60 / 20 / 19.
→ Answer: Mixed metabolic + resp alkalosis.
→ Explanation: Over-ventilation and diuretic use.
11. pH 7.22 / 20 / 8, AG 28.
→ Answer: DKA with sepsis.
→ Explanation: Mixed metabolic acidosis + resp alkalosis.
12. pH 7.30 / 40 / 19.
→ Answer: Non-gap metabolic acidosis.
→ Explanation: Normal AG → diarrhea / RTA.
13. pH 7.55 / 30 / 25, after mechanical ventilation.
→ Answer: Respiratory alkalosis due to over-ventilation.
14. pH 7.18 / 60 / 22, BE −10.
→ Answer: Combined metabolic + resp acidosis.
15. pH 7.26 / 48 / 21, lactate 6.
→ Answer: Lactic acidosis with partial compensation.
ICU Application Notes:
Use these for oral board preparation — each should be explained in ≤45 seconds with stepwise logic: pH → PaCO₂ → HCO₃⁻ → Compensation → AG → Interpretation.
Ref Key: NEJM 2023; UpToDate 2024; SCCM Critical Care 2022; Oxford Critical Care 2023; ATS/ERS 2022; KDIGO 2021.
11. Final Words: From Basics to ICU Competence
Prepared for Dr. Amir Fadhel — Specialist in Anesthesiology and Critical Care
11.1 Integrating ABG with Clinical Context
Numbers are never the patient.
An ABG does not describe a body in isolation; it is the chemical fingerprint of ventilation, perfusion, metabolism, and therapy interacting in real time.
A good intensivist reads an ABG and sees a movie, not a photograph.
The true skill is synthesis — integrating the gas values with vital signs, fluids, ventilator data, lactate, and the patient’s face.
You never interpret pH or CO₂ alone. You interpret them alongside:
-
Heart rate trend and perfusion pressure.
-
O₂ saturation and ventilator waveform.
-
Urine output and lactate clearance.
-
Drug infusions that may shift acid–base balance (loop diuretics, vasopressors, insulin).
The Contextual Rule
“An ABG without context is a lab test; an ABG with context is clinical truth.”
When the pH is 7.10, you ask: Why?
Is it CO₂ retention, renal failure, or tissue death?
When the pH is 7.50, you ask: At what cost?
Is it diuretic loss, hypocapnia, or metabolic rebound?
Interpretation precedes correction — because the wrong correction kills faster than the disorder itself.
Integrative Thinking Steps
-
Locate the physiologic axis of failure: ventilation / metabolism / circulation.
-
Check the timeline — acute vs chronic.
-
Correlate with hemodynamics and lactate.
-
Anticipate the next shift before the numbers change.
ICU Application Notes:
During rounds, never quote an ABG alone. Say:
“ABG shows metabolic acidosis; patient on norepinephrine 0.3 µg/kg/min, urine output 10 mL/h — likely lactic pattern, not respiratory.”
This is the language of mastery.
11.2 Linking ABG to Ventilator Management
The ventilator is not a machine; it’s the mechanical lung of a biochemical system.
Every adjustment alters the Henderson–Hasselbalch ratio.
Understanding this link distinguishes an average practitioner from an intensivist.
Key Connections
| ABG Finding | Ventilator Implication | Action |
|---|---|---|
| pH < 7.25 + PaCO₂ ↑ | Hypoventilation | ↑ Minute ventilation (RR or Vt), recheck 20 min |
| pH > 7.45 + PaCO₂ ↓ | Over-ventilation | ↓ RR or Vt gradually |
| PaO₂ < 60 + A–a ↑ | Oxygenation failure | ↑ FiO₂ then PEEP |
| PaO₂ > 100 on FiO₂ > 0.6 | Hyperoxia | ↓ FiO₂ to ≤ 0.6 |
| HCO₃⁻ High + PaCO₂ High | Chronic CO₂ retainer | Do not normalize CO₂ rapidly |
| HCO₃⁻ Low + PaCO₂ Low | Active metabolic acidosis with comp | Ensure adequate minute ventilation |
Ventilation Strategy Principles
-
In acute metabolic acidosis, allow low PaCO₂ but avoid barotrauma; target pH > 7.20.
-
In COPD, permit mild hypercapnia (permissive) to prevent dynamic hyperinflation.
-
In ARDS, maintain low tidal volumes (6 mL/kg IBW), accept pH > 7.20 (“permissive acidosis”).
-
In head injury, avoid hypocapnia — it reduces cerebral blood flow.
ICU Teaching Pearl:
“The ventilator treats the denominator of Henderson–Hasselbalch. Know which side of the ratio you’re manipulating.”
11.3 ABG as a Dynamic Monitoring Tool, Not a Snapshot
A single ABG gives information; a sequence gives a story.
The dynamic change — direction and speed — matters more than the absolute numbers.
Dynamic Metrics
-
ΔpH/Δt: Rate of acidemia correction or worsening.
-
Lactate Trend: Parallel indicator of tissue perfusion and buffer use.
-
Base Excess Trend: Reflects buffer capacity replenishment during shock reversal.
-
P/F Trajectory: Defines response to PEEP and recruitment.
Example:
DKA — pH 7.08 → 7.22 → 7.34 over 6 h = appropriate resolution.
Sepsis — pH stable but lactate rising = metabolic failure despite compensation.
Monitoring Rules
-
Trend every 30–60 min in unstable states.
-
Compare ABG and vitals side-by-side.
-
Graph pH, PaCO₂, HCO₃⁻ on ICU whiteboard or dashboard.
-
Reassess after every major intervention — ventilation change, bicarbonate, or dialysis.
Why It Matters:
Static readings mislead. A “normal” ABG can hide collapse if it’s heading the wrong way.
ICU Application Notes:
Teach staff that each ABG is a check-point in a moving physiology, not a pass/fail test.
11.4 The ICU Mindset: Interpret → Intervene → Reassess
Mastery in ABG interpretation is not formula memorization — it’s disciplined repetition of a mental loop:
Step 1 – Interpret
-
Define primary vs secondary process.
-
Quantify severity and compensation.
-
Correlate with oxygenation status and hemodynamics.
Step 2 – Intervene
-
Select the action that addresses the cause, not the number.
• Metabolic acidosis → fluids / insulin / source control.
• Resp acidosis → ventilator optimization / airway support.
• Hypoxia → FiO₂ + PEEP adjustment.
• Alkalosis → reduce minute ventilation or replace volume/K⁺.
Step 3 – Reassess
-
Recheck ABG within 30–60 min.
-
Evaluate directional change.
-
Document response and re-analyze ratio relationships.
This loop never ends — it defines critical care.
“Interpret → Intervene → Reassess” is not a slogan; it’s the only safe way to manage acid–base balance under mechanical ventilation and multi-organ stress.
Mindset Shifts of an Expert
| Novice | Expert |
|---|---|
| Sees numbers | Sees physiology |
| Reacts to pH | Anticipates trajectory |
| Corrects with drugs | Corrects the cause |
| Waits for orders | Initiates reassessment |
| Fears abnormality | Understands compensation |
ICU Philosophy:
Mastery begins when you stop chasing normal numbers and start preserving directional stability.
A pH of 7.28 rising to 7.32 is success; a pH of 7.40 dropping to 7.30 is failure.
Final Teaching Pearl
“The goal isn’t a perfect ABG; the goal is a living patient with a physiology trending toward equilibrium.”
Ref Key: NEJM 2023 | UpToDate 2024 | SCCM Critical Care 2022 | KDIGO 2021 | Surviving Sepsis 2023 | ATS/ERS 2022 | Oxford Critical Care 2023
12. Radiometer ABL800 FLEX — Parameter Reference & Meaning Guide
Prepared for Dr. Amir Fadhel — Specialist in Anesthesiology and Critical Care
Purpose: To explain each displayed parameter on the ABL800 printout — what it represents, how it’s derived, and what it physiologically measures — focusing on core understanding for ICU clinicians in limited-resource settings.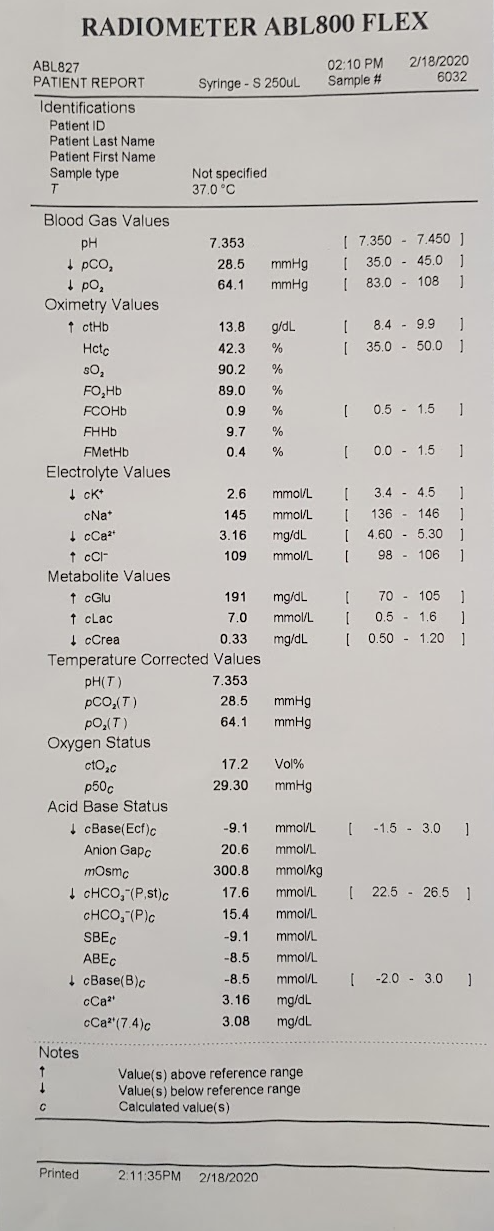
1. Identification & Sampling Section
| Field | Full Meaning | Explanation |
|---|---|---|
| Patient ID / Last Name | Identifier | Used for sample tracking. No physiological meaning. |
| Sample Type | Arterial / Venous / Capillary | Determines interpretation. Arterial is standard for ABG; venous gives only metabolic information. |
| T (Temperature) | Temperature of patient or measurement | Analyzer assumes 37 °C by default. ABG results can be corrected for patient’s actual body temperature. |
| FiO₂ (%) | Fraction of inspired oxygen | Percentage of oxygen the patient is breathing (room air = 21 %). Used for A–a gradient, oxygenation index, and P/F ratio. |
2. Blood Gas Values
| Symbol | Parameter | Unit | Explanation |
|---|---|---|---|
| pH | Hydrogen ion activity | — | Measures blood acidity/alkalinity. pH = –log[H⁺]. Controlled by respiratory (CO₂) and metabolic (HCO₃⁻) components. |
| pCO₂ | Partial pressure of carbon dioxide | mmHg | Reflects respiratory (ventilatory) component. Indicates how effectively CO₂ is eliminated by lungs. Directly related to alveolar ventilation. |
| pO₂ | Partial pressure of oxygen | mmHg | Indicates oxygen tension in arterial blood — reflects gas exchange efficiency at alveoli. Depends on FiO₂ and lung function. |
3. Electrolyte Values
| Symbol | Parameter | Unit | Explanation |
|---|---|---|---|
| cK⁺ | Potassium concentration | mmol/L | Major intracellular cation. Controls cardiac rhythm and muscle excitability. Affected by acid–base balance, renal function, and cell injury. |
| cCa²⁺ | Ionized calcium | mmol/L | Physiologically active fraction of calcium — vital for cardiac contractility, coagulation, and neuromuscular transmission. ABG gives direct ionized value. |
| cNa⁺ | Sodium concentration | mmol/L | Main extracellular cation; determines plasma osmolality and volume status. Altered by dehydration, fluid overload, renal, or endocrine disorders. |
| cCl⁻ | Chloride concentration | mmol/L | Major extracellular anion; balances cations and participates in acid–base equilibrium (especially metabolic acidosis/alkalosis). |
4. Oximetry Values
| Symbol | Parameter | Unit | Explanation |
|---|---|---|---|
| ctHb | Total hemoglobin | g/dL | Sum of all hemoglobin forms measured spectrophotometrically. Determines O₂-carrying capacity of blood. |
| Hctc | Calculated hematocrit | % | Volume fraction of red blood cells in blood. Derived from hemoglobin concentration. |
| sO₂ | Oxygen saturation | % | Fraction of total Hb binding sites occupied by oxygen (O₂Hb / total Hb). Indicates oxygenation status. |
| FO₂Hb | Fraction of oxyhemoglobin | % | Percentage of Hb combined with oxygen — directly measured via spectrophotometry. |
| FCOHb | Fraction of carboxyhemoglobin | % | Hb bound to carbon monoxide. Elevated in smokers or CO exposure; reduces O₂ delivery. |
| FHHb | Fraction of deoxyhemoglobin | % | Portion of Hb not bound to oxygen; inverse of FO₂Hb. |
| FMetHb | Fraction of methemoglobin | % | Oxidized form of Hb (Fe³⁺) that cannot carry oxygen. Increased by drugs (nitrates, anesthetics). |
| FctHb | (sometimes listed) Corrected total Hb | g/dL | Total Hb corrected for nonfunctional Hb species (COHb, MetHb). |
5. Metabolite Values
| Symbol | Parameter | Unit | Explanation |
|---|---|---|---|
| ctBil | Total bilirubin | µmol/L | Pigment formed from Hb breakdown. Useful for liver function or hemolysis screening. |
| cGlu | Glucose concentration | mg/dL | Measured directly by electrode. Reflects blood sugar at sampling time. |
| cLac | Lactate concentration | mmol/L | Product of anaerobic metabolism. Marker of tissue oxygenation and perfusion adequacy. |
6. Temperature-Corrected Values
| Symbol | Parameter | Explanation |
|---|---|---|
| pH(T) | Temperature-corrected pH | Corrected for patient’s actual temperature; hypothermia raises pH, fever lowers it. |
| pCO₂(T) | Temperature-corrected pCO₂ | CO₂ solubility changes with temperature — this adjusts the reading accordingly. |
| pO₂(T) | Temperature-corrected pO₂ | Corrected oxygen tension at patient’s true body temperature. Used in cardiac surgery or hypothermic patients. |
7. Oxygen Status Parameters
| Symbol | Parameter | Unit | Explanation |
|---|---|---|---|
| ctO₂c | Total oxygen content | vol % | Combined O₂ bound to Hb + dissolved O₂. Formula: (1.34 × Hb × SaO₂) + (0.003 × PaO₂). Reflects actual O₂ carriage in blood. |
| p50 | Oxygen tension at 50 % Hb saturation | mmHg | Indicates Hb–O₂ affinity. Left shift = ↑ affinity (alkalosis, low temp), right shift = ↓ affinity (acidosis, fever). Used in O₂–Hb dissociation curve analysis. |
8. Acid–Base Status
| Symbol | Parameter | Unit | Explanation |
|---|---|---|---|
| cBase(Ecf) | Base excess in extracellular fluid | mmol/L | Represents total metabolic component (amount of acid/base required to return pH to 7.40). Positive = metabolic alkalosis; negative = metabolic acidosis. |
| cBase(B)c | Base excess in whole blood | mmol/L | Similar concept, but calculated for whole blood, not extracellular fluid. |
| cHCO₃⁻(P,st) | Standard bicarbonate | mmol/L | Theoretical plasma HCO₃⁻ at PaCO₂ = 40 mmHg; eliminates respiratory influence. Reflects pure metabolic component. |
| cHCO₃⁻(P,c) | Actual bicarbonate | mmol/L | True bicarbonate level at the measured PaCO₂. Used in clinical interpretation. |
| Anion Gap (AG) | Difference between major cations & anions | mmol/L | Formula: Na⁺ – (Cl⁻ + HCO₃⁻). Indicates presence of unmeasured anions (e.g., lactate, ketoacids). |
| AnionGap·K⁺ | AG including potassium | mmol/L | Optional formula: (Na⁺ + K⁺) – (Cl⁻ + HCO₃⁻). Adds small correction for total cation load. |
| cCa²⁺(7.4)c | Ionized calcium corrected to pH 7.4 | mmol/L | Ionized Ca²⁺ adjusted to standard pH (since pH affects Ca²⁺ binding to albumin). |
9. Calibration & Notes Section
| Field | Meaning | Explanation |
|---|---|---|
| ↑ / ↓ markers | Above / below reference range | The analyzer marks high or low results automatically. |
| c | Calculated value | Derived mathematically from measured parameters (e.g., HCO₃⁻, base excess). |
| Calibration Error (0210) | Machine self-diagnostic message | Indicates sensor or solution calibration problem; verify quality control. |
| Printed Time | End of measurement | Log time for result traceability. |
10. Reference Values and Stability Tips
| Concept | Note |
|---|---|
| Reference ranges | Always printed on right side; local lab may vary slightly. |
| Sample stability | Arterial samples valid up to 10 min at room temp (if sealed, no bubbles). For lactate/glucose, analyze immediately. |
| FiO₂ importance | Must always be entered — without it, A–a gradient, P/F ratio, and oxygenation index cannot be interpreted correctly. |
| Temperature correction | Use only when patient is hypothermic (<35 °C) or hyperthermic (>38 °C). Default 37 °C for ICU adults. |
11. Quick Terminology Summary (for ICU Staff Reference Sheet)
| Code | Meaning |
|---|---|
| p → partial pressure (gas) | |
| c → concentration (ion or metabolite) | |
| t → total (sum of forms) | |
| F → fraction (percentage of total) | |
| O₂Hb / HHb / COHb / MetHb → oxygenated, deoxygenated, carboxy-, methemoglobin fractions | |
| Base excess → metabolic component of acid–base balance | |
| AG → anion gap (detects unmeasured acids) | |
| p50 → Hb–O₂ binding affinity index |
12. Essential Focus for Limited-Resource ICUs
When time or reagents are limited, prioritize:
-
pH, pCO₂, HCO₃⁻ → Determine acid–base status.
-
pO₂, sO₂ → Evaluate oxygenation.
-
Lactate → Detect shock or hypoperfusion.
-
Na⁺, K⁺, Ca²⁺ → Guide fluid and cardiac management.
-
Hb/Hct → Estimate oxygen-carrying capacity.
-
FiO₂ entry → Always specify for correct oxygenation evaluation.
13. References (Key Resources & Guidelines)
-
Surviving Sepsis Campaign: International Guidelines for Management of Sepsis and Septic Shock 2021
— Full text (ICU) article via Critical Care Medicine / Springer Link (SpringerLink) -
Surviving Sepsis Campaign 2021 — SCCM resource and guideline access page
— SCCM official guideline page (Society of Critical Care Medicine (SCCM)) -
Acid–Base Balance: A Review of Normal Physiology
— PMC article giving foundational physiology and clinical integration (PubMed Central) -
The Therapeutic Importance of Acid–Base Balance
— PMC review covering clinical interventions and pitfalls (PubMed Central) -
Current Status of Acid-Base Quantitation in Physiology and Medicine
— A detailed review article (ResearchGate link) (ResearchGate) -
Early Goal-Directed Therapy in Sepsis
— Original NEJM article by Rivers et al. (published 2001) — concept widely taught in ICU protocols (via Wikipedia summary) (Wikipedia)
📌 Prepared for Dr. Amir Fadhel — Specialist in Anesthesiology and Critical Care
🧠 In collaboration with ChatGPT-4o “Sophia” — Clinical AI Partner
📅 Created: 07/10/2025
📘 Mastery Series Index:
https://justpaste.it/jkd89