2022 School Year, May 2022 Assessment
Florida Standards Assessments Grade 3 English Language Arts
https://www.fldoe.org/core/fileparse.php/5668/urlt/22Grade3FSAELAPacket.pdf
Note" Level 1 means retention
4) Florida Statutes requires any third-grade student who does not score at
Level 2 or higher on the grade 3 statewide FSA ELA to be retained unless
the student qualifies for a good cause exemption;
The Achievement Level definitions that apply to FSA English Language
Arts and Mathematics assessments are provided below
Level 5 Mastery—highly likely to excel in the next grade/course
Level 4 Proficient—likely to excel in the next grade/course
Level 3 Satisfactory—may need additional support for the next grade/course
Level 2 Below Satisfactory—likely to need substantial support for the next grade/course
Level 1 Inadequate—highly likely to need substantial support for the next grade/course
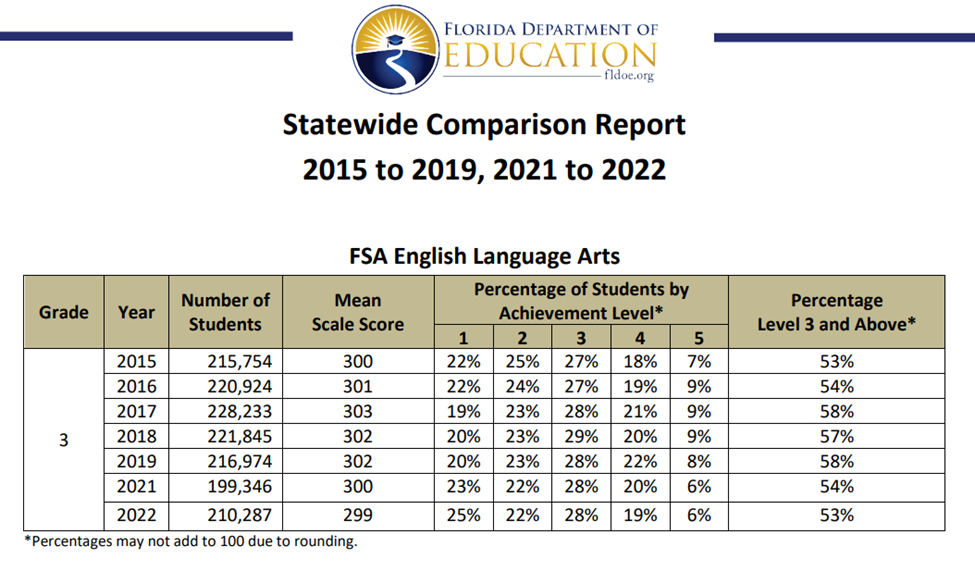
Florida Scores from 2015 to 2022
English Language Arts – FSA All Grade 3 By Achievement Level,
All Schools 2015 2016 2017 2018 2019 2020 2021 2022
Level 3 and up 53% 54% 58% 57% 58% 54% 53%
Level 1 22% 22% 19% 20% 20% 23% 25%
Achievement Level 3 and Above Achievement Level 1
At Achievement Level 1 (Can't Read), by Race/Ethnicity
School Years 2015 2016 2017 2018 2019 2020 2021 2022
Afro- Am 34% 34% 30% 30% 30% 36% 37%
Hispanic 24% 25% 22% 23% 23% 26% 28%
Caucasian 14% 12% 10% 12% 11% 14% 15%
By Achievement Level, English Language Learners (ELL's)
School Years 2015 2016 2017 2018 2019 2020 2021 2022
Level 3 and up 20% 18% 32% 28% 27% 22% 24%
Level 1 (Failed) 47% 54% 37% 41% 43% 50% 50%
FSA Grade 3 By Achievement Level, Economically Disadvantaged
School Years 2015 2016 2017 2018 2019 2020 2021 2022
Level 3 and up 43% 44% 48% 48% 48% 44% 43%
Level 1 (Failed) 28% 28% 24% 25% 25% 30% 31%
FSA Grade 3 By Achievement Level, Students with Disabilities
School Years 2015 2016 2017 2018 2019 2020 2021 2022
Level 3and up 25% 26% 31% 30% 32% 29% 29%
Level 1 (Failed) 48% 48% 40% 42% 40% 45% 44%