Decoding the Descending Triangle: A Technical Analysis Tool for Traders
Technical analysis is a vital tool for traders in the financial markets to make informed judgements. The descending triangle is a common chart pattern encountered by traders. This pattern has received a lot of attention because of its potential to provide useful insights about future price fluctuations. We will look at the descending triangle pattern, its properties, and how it may be used in trading techniques in this post.
Understanding the Descending Triangle:
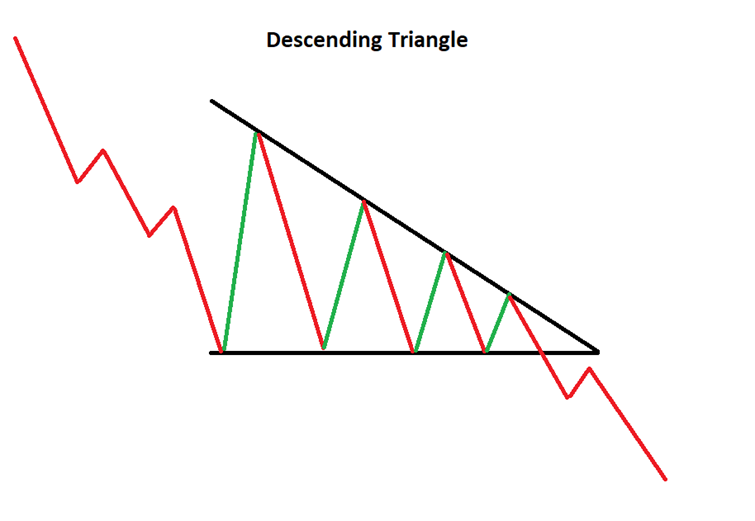
A descending triangle is a bearish chart pattern that appears during a downtrend. It has a succession of lower highs and a horizontal support level connecting the swing lows. The descending triangle looks like a right-angled triangle, with the descending upper trend-line intersecting the horizontal support line.
The pattern denotes a period of consolidation and a conflict between buyers and sellers. Buyers are unable to drive the price higher as it approaches the horizontal support level, resulting in lower swing highs. In the meantime, sellers gain confidence and become more aggressive, perhaps leading to a collapse below the support level.
What does it tell you?
The falling triangle pattern implies a conflict between buyers and sellers, with sellers gradually gaining an advantage. Lower highs suggest that buyers are less eager to drive the price up, whilst the horizontal support level indicates that sellers are putting pressure to keep the price from rising. This tug of war frequently results in a breakout, which provides traders with significant information about probable future price movements.
How to Spot a Descending Triangle?
Identifying a falling triangle necessitates a sharp eye for chart patterns. Here are the critical steps to identifying this formation:
- Downtrend: Look for a definite downtrend in the price chart, which is characterised by a series of lower lows and lower highs.
- Horizontal Support: Locate a horizontal support level generated by many touches at the same price point.
- Descending Trend-line: Draw a trend-line linking the lower highs to form a downward-sloping line.
If the price frequently bounces off the support level while the descending trend-line remains intact, you've most certainly spotted a descending triangle pattern.
Descending Triangle Breakout Strategy:
Trading a descending triangle pattern requires persistence, close attention to detail, and prudent risk management. Here is a detailed instruction:
- Confirm the Pattern: Wait for the price to at least twice contact the horizontal support level and the falling trend-line to hold with lower highs in order to confirm the pattern.
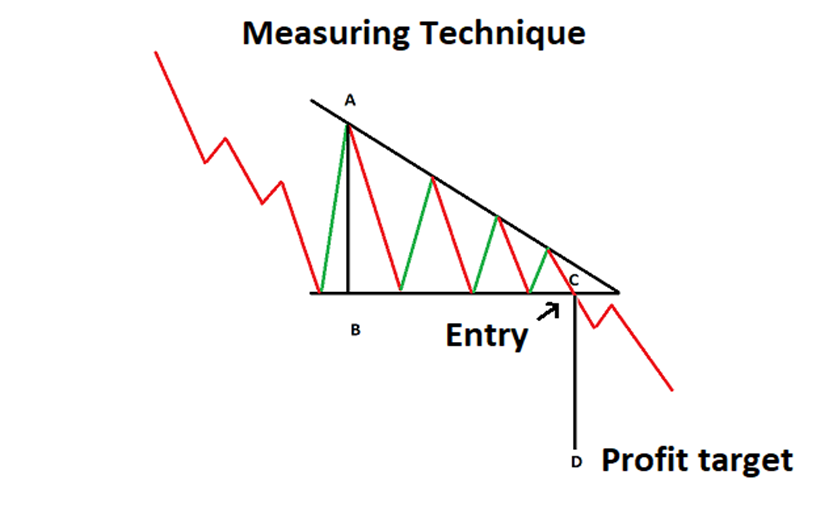
- Entry Point: When the price dips below the horizontal support level, start a short position. This breakdown suggests that purchasing demand has been outweighed by selling pressure, which could result in a further downturn.
- Stop Loss: To reduce potential losses in the event of a false breakout or an unexpected reversal, set a stop-loss order above the breakout point.
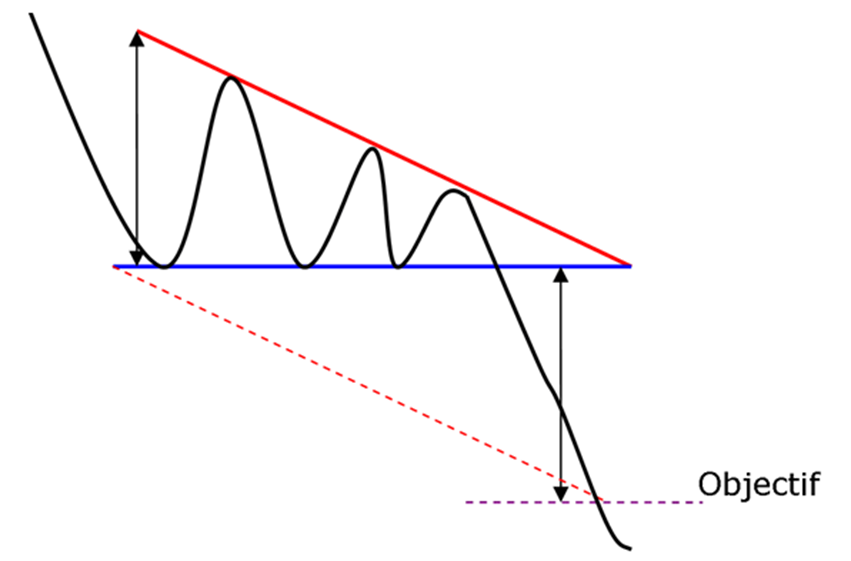
- Profit Target: Calculate the price objective depending on the height of the pattern. Project the distance from the highest point of the triangle to the support level downward from the breakout point.
- Risk Management: Before entering a trade, calculate your risk-reward ratio to ensure that prospective earnings outweigh potential losses. Consider altering the position sizes and leverage as needed.
Descending Triangles with Heikin-Ashi Charts:
Heikin-Ashi charts are a sort of candlestick charting technique that includes time and volume information to create a more seamless portrayal of price patterns. Using Heikin-Ashi charts to analyze a descending triangle, traders can acquire extra information into the pattern's power.
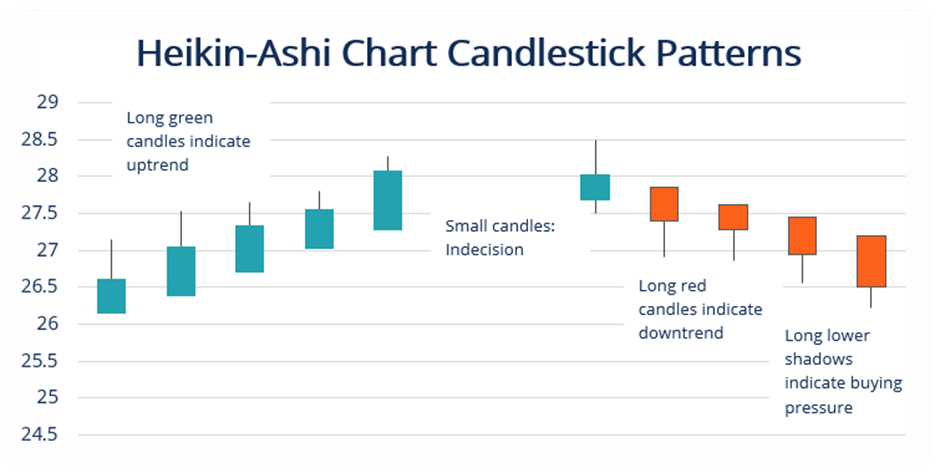
Using modified candlestick calculations, the Heikin-Ashi approach helps to filter out noise and determine the dominant trend. When applied to descending triangles, it can assist traders more accurately detect future breakouts. A convincing bearish breakthrough on a Heikin-Ashi descending triangle chart affirms the downtrend's continuation, providing a stronger signal to go short.
Descending Triangle with Moving Averages:
Moving averages are frequently employed as technical analysis indicators to smooth out price data, spot probable trend reversals, or confirm current trends. Trading professionals frequently use moving averages to further validate the bearish character of descending triangle patterns.
Traders can see how the price responds to these trend-following indicators by superimposing moving averages on a descending triangle chart. Using a 200-day moving average along with a shorter-term moving average, like the 50-day moving average, is a typical strategy. A bearish crossover, where the shorter-term moving average crosses below the longer-term moving average, strengthens the likelihood of a downward breakout and emphasizes the descending triangle's negative bias.
Advantages and limitations of the descending triangle:
The ability of the descending triangle to offer traders with a clear and specific signal to start a short position in the market is one of its primary advantages. This pattern often suggests that the asset's price is about to break down, which can be a rewarding chance for traders who can capitalize on this movement. Furthermore, the descending triangle pattern can be utilized to identify probable price goals for the asset, which can assist traders in more efficiently planning their transactions.
It is crucial to highlight, however, that the descending triangle is not without flaws. As with all chart patterns, it is susceptible to false signals and market volatility, which can result in unanticipated price moves that contradict the pattern's predicted consequences. As a result, traders should always use caution and not base their trading decisions only on this pattern.
Descending triangle measuring technique:
To calculate the descending triangle pattern, traders often begin by locating the pattern's support level, which is the horizontal line connecting the asset's lowest price points. After establishing this line, traders can build a trend-line connecting the asset's declining highs. The pattern's "apex" is the point at which these two lines intersect.
Traders can compute the probable price target for the asset by measuring the distance between the support level and the apex and subtracting this number from the support level. This formula gives traders with a predicted price goal for the asset, which they can use to better plan their trades.
Conclusion:
In conclusion, the descending triangle is a negative chart pattern that can be used to forecast future price movements in financial markets. While this pattern has some positives, such as providing traders with unambiguous signals to begin short positions and identify potential price goals, it also has limitations and false signals. As a result, traders should exercise caution when making trading choices and use the descending triangle in conjunction with other technical indicators and fundamental analysis.