Permalink - https://tinyurl.com/yhfn9je8
VIDEO: "There is No Novel Coronavirus". A Computer Generated Pathogen Became the Blueprint for the Injectable Bioweapon.
________________________________________________________________________________________________________
An All-Cause Mortality Study by Prof. Deni Rancourt supports the NO VIRUS Paradigm
"... if governments around the world had not announced a 'pandemic' and then taken disastrous actions, no extra people would have died." -- Deni Rancourt

Video: https://tinyurl.com/57ur66ee
Dr. Rancourt and others have teased out the data on all-cause mortality to report they cannot find a virus as the cause of death because all the excess deaths can be attributed to so-called "collateral damage" as a byproduct of tyrannical measures of unemployment, depression, suicides, poverty, medical malpractice.... etc. So it was the psychological warfare that mostly killed people while the PCR test made it appear there were a tremendous number of "cases" - promoted by the media as sick people, whether they were ill or perfectly healthy.
When Dr. Birx announced the FLU was no longer being counted by the CDC, those illnesses were tossed into the mix and called "Covid". This trick didn't increase all-cause mortality because the numbers were already baked-in from data gathered in previous years, but were used as medical terrorism to ramp-up a state of fear that is known to cause premature deaths.
STUDY: Poverty Kills More Americans Than Obesity, Diabetes, and Drug Overdoses
__________________________________________________________________________________
_________________________________________________________________________________
Lockdowns and Fear Caused Covid Deaths
Video: https://tinyurl.com/2rt3k394
Dr. Retsef Levi recently reported data from Israel that essentially agrees with Dr. Rancourt's findings and the NO VIRUS paradigm.
"Our findings were very, very clear and dramatic. We actually showed that the loss of life caused by the Lockdowns is likely to be hundreds if not thousands of times more than all the life lost by the Covid-19 virus."
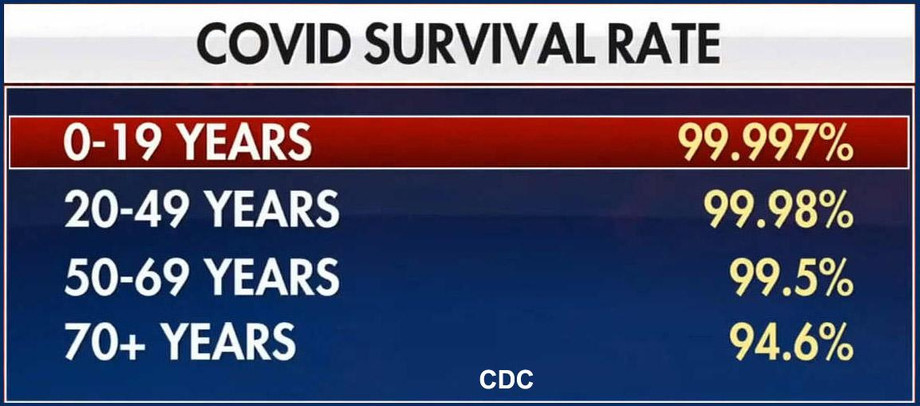
Remember in 2020 how the CDC's own numbers reported a "Covid-19" survival rate of over 99.6% for everyone up to age 85? These numbers approximate the survival rate of the annual FLU.
Is it a coincidence that in 2020, Dr. Deborah Birx announced the CDC would stop reporting the FLU numbers during the Covid crisis? And did seasonal FLU numbers become dishonestly tabulated as Covid-19 mortality due to a phantom virus.? (yes)
So where is the "Gain of Function" in a virus that can't be proven to exist.? And how can Sar-CoV-2 be called a "weaponized virus", released from a Wuhan Lab if there's insufficient proof that anyone died from SARS-Cov-2 ?
__________________________________________________________

_______________________________________________________
VIDEO: Steve Kirch Interview with Sasha Latypova
_______________________________________________________
Dr. Simon Goddek Site - Dr. Simon Goddek BIO:
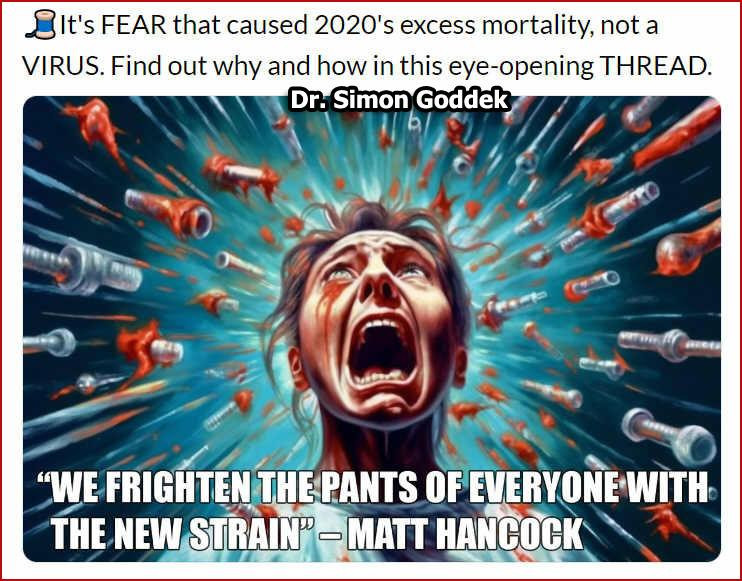
It's Fear that caused 2020's excess mortality, not the COVID-19 virus.
ARCHIVE: https://archive.is/Ay2el
_______________________________________________________
COVID death total: this is MY BOMBSHELL REPORT on the fraud
And guess what? It’s simple. No charts, no graphs. You don’t need a PhD in statistics to understand it...
Let’s start with the World Health Organization report on the total number of global COVID deaths, as of late October this year:
Globally, as of 5:43pm CEST, 28 October 2022, there have been 626,337,158 confirmed cases of COVID-19, including 6,566,610 deaths, reported to WHO.
OK? Let’s round that number off to 6.6 million deaths.
Now let’s go to a report on worldwide NON-COVID pneumonia deaths, from Our World in Data:
2.5 million people died from pneumonia in 2019.
The first number, the total of COVID deaths, from the World Health Organization, takes in a period of two years plus about 10 months. To be generous, I’ll cut that down to two years and eight months. Two and two-thirds years.
So — if you take the pneumonia death number for ONE year, and multiply it by two and two-thirds years, what do you get?
I get 6.66 million. 6.66 million NON-COVID pneumonia deaths.
Almost exactly the total number of official COVID deaths.
Boom.
Now I could go off in a number of directions from this point. But I won’t.
I’ll just ask a few burning questions. And keep this in mind: pneumonia, and death from pneumonia, has been racking up huge numbers on the planet for decades, centuries. Not just for the past two years.
Here are the questions:
Have you heard of any widespread restrictive measures being placed on populations because of PNEUMONIA?
Masks?
Distancing?
Contact tracing?
Lockdowns?
School and business closures?
Severe wall-to-wall media and government warnings?
Enormous vaccination campaigns?
Vaccine mandates?
Public shaming?
No?
Case closed.
Taking the long view, which is the only view, non-COVID pneumonia has been far more serious than COVID, over time.
Yet the official pneumonia policy — unspoken — has been: LIVE YOUR LIFE; GO ABOUT YOUR BUSINESS.
Some people will try to deflect these facts and issues by saying, “Well, without all the restrictive COVID measures, the death toll would have been much greater.”
To which I reply: Good luck in arguing, against convincing studies, that masks and lockdowns and arbitrary distancing actually lowered the death toll from COVID. And keep in mind that medical treatments — all sorts of treatments — have been available for pneumonia, for decades. And there are vaccines. So if you want to say the medical cartel has been quite successful with COVID, I could say the cartel has been quite successful with pneumonia, and without their treatments, the pneumonia death toll would also be far higher. Just like COVID.
Case closed.
LIVE YOUR LIFE. GO ABOUT YOUR BUSINESS. Just as with pneumonia, that should have been the COVID policy from the beginning.
Of course, as my long-time readers know, I’ve exposed the COVID fraud in FAR deeper ways, in hundreds of articles over the past two years and eight months (archive here; republishing here). But here I’m simply using official statistics, and showing you the egregious predatory insanity at work.
Case closed. -- Jon Rappoport
________________________________________________________
A Big Pharma /Globalist/ Fraud Construct: Deadly Viral Pandemics Are Not Possible - Global research - Dr. Stephen Frost, June 10, 2023
________________________________________________________
NO VIRUS PARADIGM - Sign on to the list of over 10,000 supporters of SOVI - "Statement On Virus Isolation" https://tinyurl.com/2csrz6wh
________________________________________________________
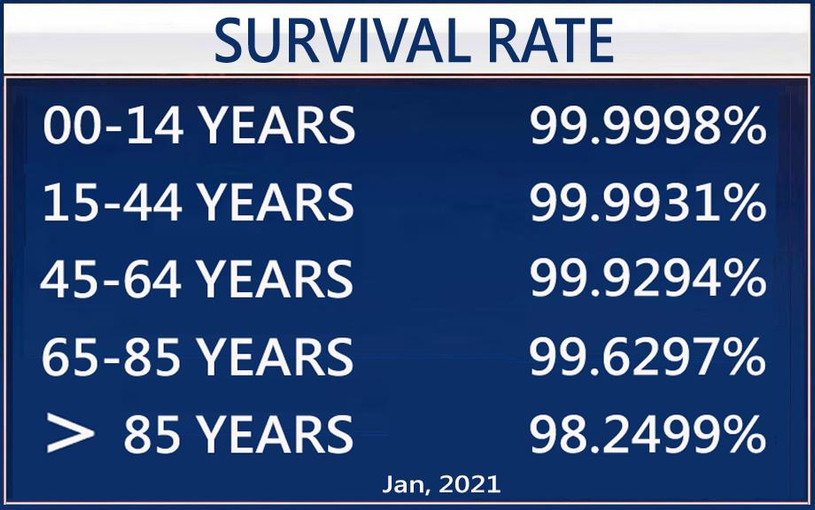
The data on deaths from Covid-19 comes from the CDC from January 27, 2021.
The most current data can be found here.
Interestingly, the CDC changed their bookkeeping recently by lumping different age groups together. However, the data in the video comes from January 27, 2021 when the age groups were more detailed. That data was removed by the CDC, but here are two screenshots of the data from January 21, 2021 and February 3, 2021.
Here is the raw data and the calculations used in the video:
As of January 27, 2021
| US Population by Age | |
| Number | Age |
| 3,783,052 | Under 1 year |
| 15,793,631 | 1–4 years |
| 40,994,163 | 5–14 years |
| 42,687,510 | 15–24 years |
| 45,940,321 | 25–34 years |
| 41,659,144 | 35–44 years |
| 40,874,902 | 45–54 years |
| 42,448,537 | 55–64 years |
| 31,483,433 | 65–74 years |
| 15,969,872 | 75–84 years |
| 6,604,958 | 85 years and over |
| 328,239,523 | Total |
| Deaths from Covid by Age (as of 1/27/21) | |
| All ages | 359,352 |
| Under 1 year | 42 |
| 1–4 years | 21 |
| 5–14 years | 58 |
| 15–24 years | 537 |
| 25–34 years | 2,335 |
| 35–44 years | 6,139 |
| 45–54 years | 16,760 |
| 55–64 years | 42,031 |
| 65–74 years | 76,404 |
| 75–84 years | 99,342 |
| 85 years and over | 115,683 |
| Age | Death % (from Covid) | Living % |
| 0-14 | 0.0002% | 99.9998% |
| 15-44 | 0.0069% | 99.9931% |
| 45-64 | 0.0706% | 99.9294% |
| 65-85 | 0.3703% | 99.6297% |
| Over 85 | 1.7501% | 98.2499% |
Your chance of being struck by lightning in your lifetime according to U.S. Weather Service is one out of 15,300 or .0065% which is about your chance of dying from Covid if you are 15-44 years of age. It’s less if you are younger and more if you are older.
Source: Children"s Health Defense
https://childrenshealthdefense.org/covid-vaccine-secrets/resources/
_______________________________________________________________________________________
Previous data from 9/10/2020 shows similar statistics

SEE TABLE 1, Scenario 5. Recovery rates are based on CDC "best estimate" on planning scenarios at date of publication (Sept 10, 2020). Current numbers may vary but most likely in the direction of higher percentage of recovery, especially in the 50-69 and 70+ year range as medications like hydroxychloroquine and Ivermectin prevent hospitalization and delivery of in-hospital care improves.
Data derived from CDC publication, Sept 10, 2020


