
In today’s fast-paced business environment, managing projects efficiently requires more than just planning, it demands real-time insights and data-driven decision-making. That’s where project management charts come into play.
From tracking timelines to optimizing resources and mitigating risks, visual tools help teams stay on top of every project phase with clarity and precision.
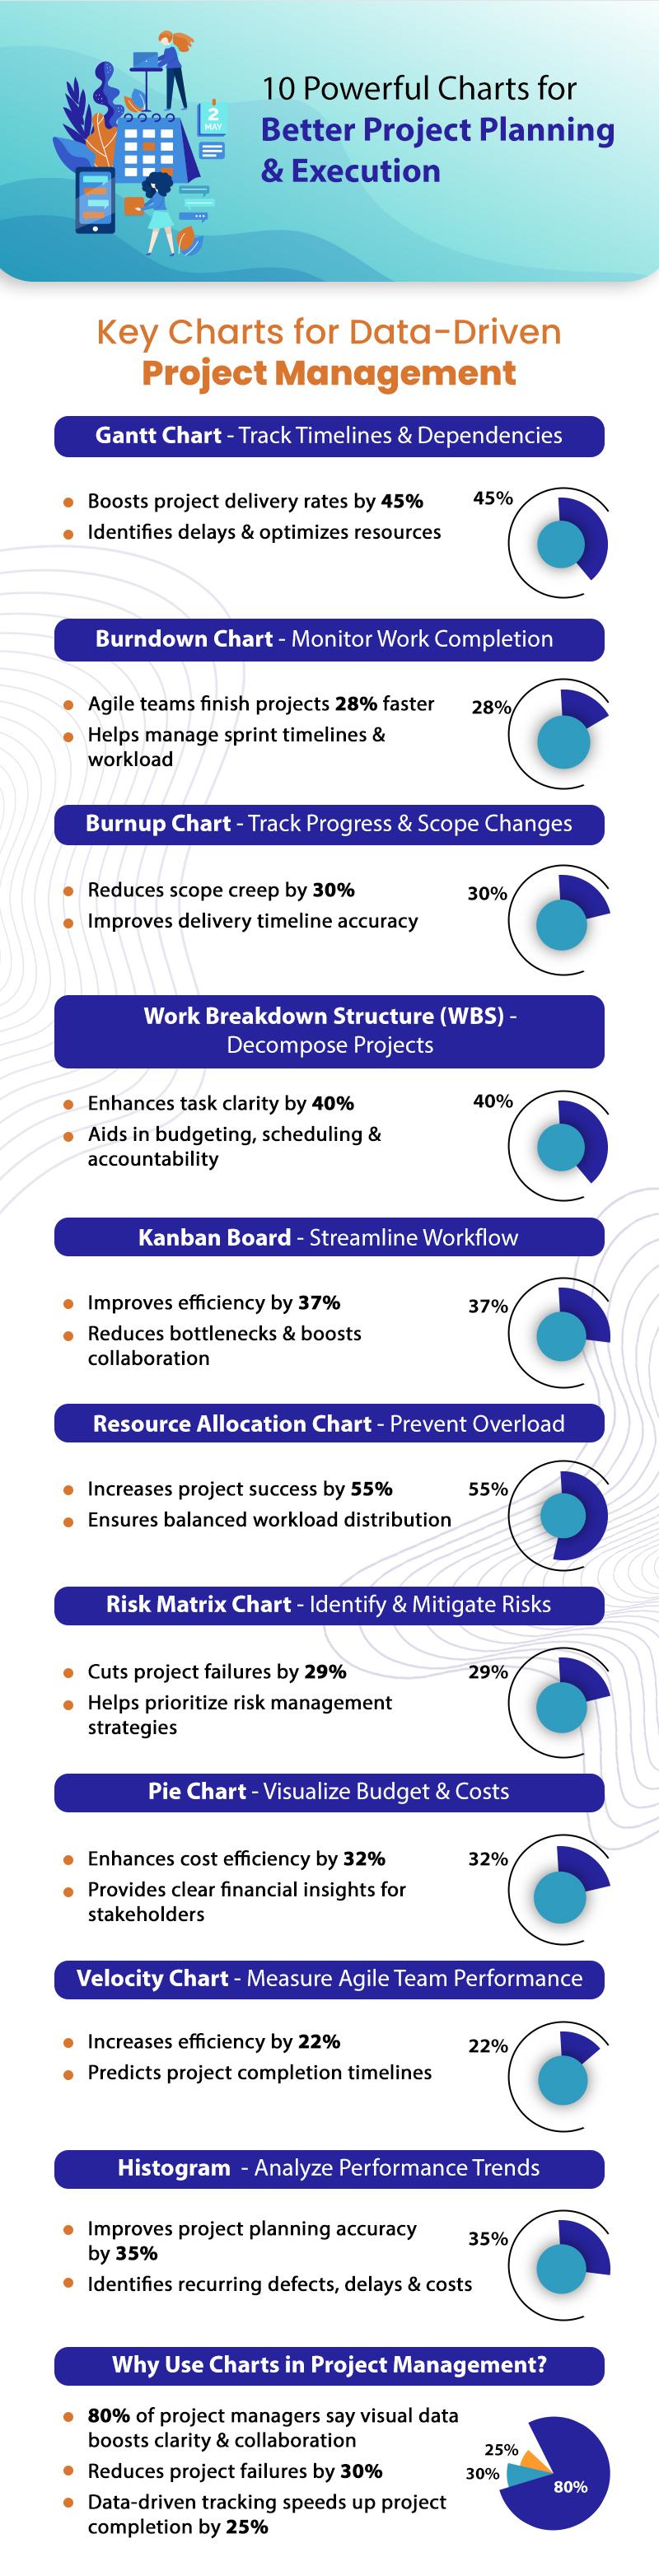
Studies show that 80% of project managers believe visual data improves collaboration and project success.
In this guide, we explore 10 essential charts that drive smarter project management, boost efficiency, and ensure seamless execution.