Chrome DevTools is a set of web developer tools built directly into the Google Chrome browser. DevTools can help you edit pages on-the-fly and diagnose problems quickly, which ultimately helps you build better websites, faster. As a digital marketing agency, it’s essential to understand the backend of technology to be able to provide better solutions, faster.
And improved site performance is essential for any brand to have better visibility, and to prepare better inbound marketing strategies.
Two important Google Chrome DevTools to improve your site performance are –
- Performance Tool
- Audit tool or Lighthouse
How can you access these tools?
- Load your website in a Chrome browser
- Right click on you webpage
- Click on ‘inspect Element’
- You will see different tabs – Elements, Console , Sources , Network, Performance, Memory, Application, Audits (recently named as Lighthouse) , Security
Here, we are going to discuss two tools which are on 5th and 8th tab from the left when we access the “inspect element” section of the webpage
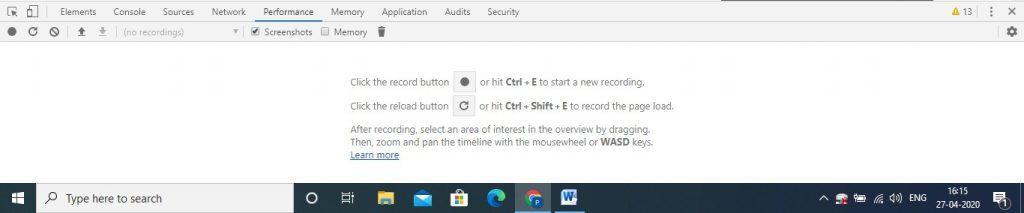
Performance Tool:
- To record Ctrl + E
- To reload Ctrl+Shift+E (to record page load)
Performance tool helps you to check load time of each element on your webpage. It helps to check runtime performance and load performance. Runtime performance is the performance of page when it is running and load performance refers to the performance of the page when it is loading. Both help to identify performance issues that affect speed and overall user experience.
This performance report shows frame by frame load time.
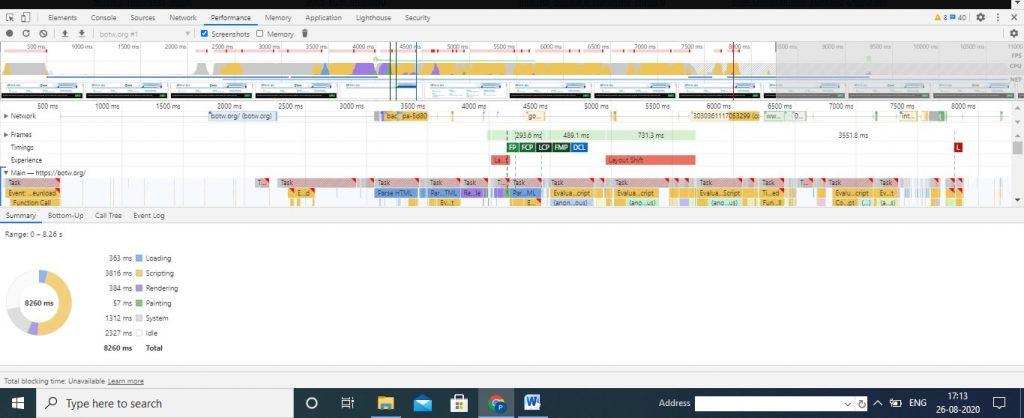
While running a performance tool, you will see load time taken by each element. You will encounter different terminologies on horizontal frames such as FP, FCP, LCP, FMP, DCL etc. Let’s have a look at each of these terms.
FP – First Paint
It is the time taken by first pixel when painted onto the webpage.
FCP – First Contentful Paint
It is a first content render on the webpage when user browses the website.
LCP – Largest Contentful Paint
It measures the loading performance of a website. LCP means time taken by largest element on the website to load. Ideal LCP score should not be more than 2.5 seconds.
FMP – First Meaningful Paint
As the name suggests, First Meaningful Paint means the time taken to provide the first meaningful information to users.
DCL – DOM Content Loaded
It measures when the HTML document on a webpage is loaded and parsed.
Audit or Lighthouse Tool:
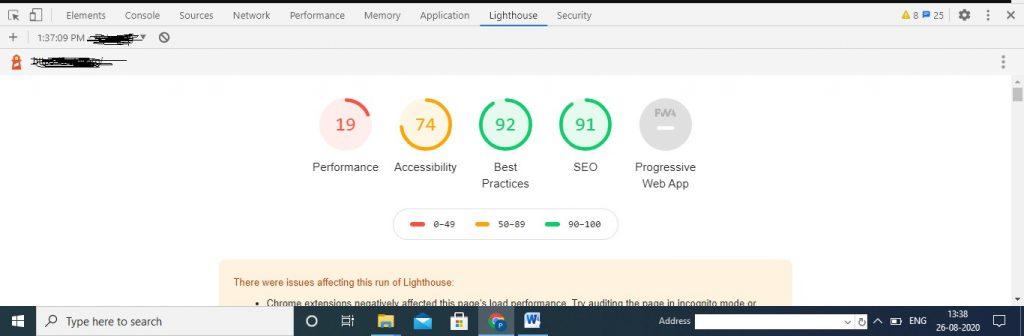
An Audit tab gives you an overview of the metrics that improves performance, accessibility, SEO and other best practices areas. It is also known as Google lighthouse report.
This is what the Lighthouse pane looks like (see below). You can check scores of the above-mentioned metrics for your website. They give scores for both the devices i.e. mobile as well as desktop. You can also check the performance score for the Progressive Web App if you have it.
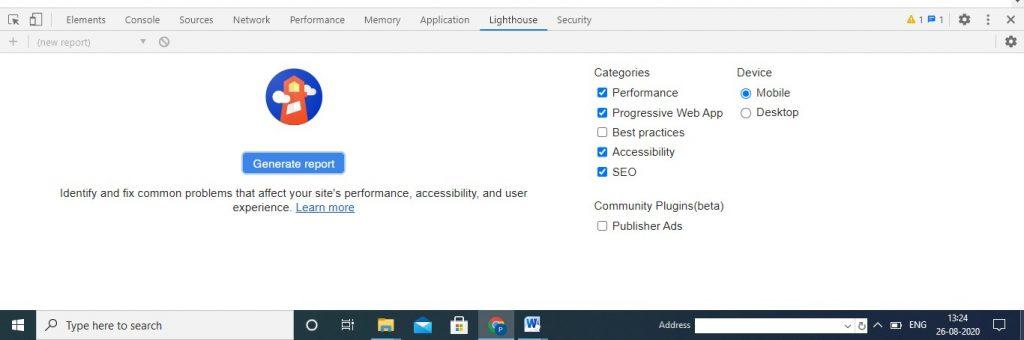
To run this tool, you have to right click on the webpage you want to test. Then, click on “Inspect Element”. It opens up a pane where you will see this Lighthouse tab. After clicking on a “Generate Report”, it will provide a score as shown below –
With Lighthouse reports, you may get these recommendations that can help you to improve site speed –
A. Performance
- Information regarding render-blocking resources
- Server response time
- Information about impact of third party codes on the website
- Header information and server push
- JavaScript execution time
- Website cache policy
- Number of requests to resources required to load the webpage i.e. request count
- LCP (Large Contentful Paint elements) & CLS (Cumulative Layout Shifts on elements) issues. Read more about LCP & CLS issues here – https://support.google.com/webmasters/answer/9205520?hl=en
- Information about minifying CSS & JavaScripts as well as HTML
- Image Sizes and formats
- DOM size
- Network payloads
- Unused codes like CSS and JS
- Recommendations on animate content
B. Accessibility
- Colours and contrast
- Navigations
- Names and labels for images, links and form elements
- Meta viewport tag for mobile
- Language attributes
C. Best Practices
- Security aspects of JavaScript libraries used
- Security in terms of HTTPS signals
- Security aspects of cross-origin destinations
- Copy-paste values into form fields
D. SEO
- Image alt attributes
- Tap sizes on mobile devices
- Structured data
- Meta viewport tags for mobile
- Meta title and descriptions
- HTTP response code
- Status for robots.txt
- Indexing status
- Hreflang tags and canonical tags
- Font sizes
- Information about plugins
E. Progressive Web App
- Page load information on mobile networks
- Information about installability such as service worker and web app manifest
- Redirections
- Use of HTTPS
- Cross-browser functionality
- And other PWA optimisation aspects
Bonus: Alternative to Google Chrome Lighthouse tool is web.dev
Hope running these easy tests will help improve your site speed and performance. If you need any assistance to audit your website, contact Liqvd Asia tech and SEO support here!