Stock price movement has a chaotic element, in the sense that you cannot predict the price movement due to the speculative capital and larger players' unpredictable intents. But you can assign the maximum possible loss your selected stock or stocks can bring you. This measure is called VAR or value at risk. IT defines what could be your maximum possible loss on your stock chosen or loss for your asset portfolio for a given time interval, given a high confidence level of (95 or 99%). First, let me talk about how to calculate a VAR for a single asset, and then I will talk about how to calculate for a portfolio. In this example, I will be talking about stocks, but you can calculate VAR for other financial assets, including FX, Commodities. VAR is not an expected loss of your stock or portfolio. VAR is the maximum possible loss of your stock or portfolio for a given period.
VAR calculation for a single stock is straightforward. You indicate your investment volume, the amount you want to invest, calculate the stock's standard deviation, define the number of days you are planning to hold your stock, determine the confidence level, how accurate your calculation should be, and calculate the inverse of the normal distribution or the stress test, and your result will be ready.
To calculate the inverse of the normal distribution, open an Excel and use the formula NORMSINV (your confidence level). To calculate the standard deviation, use the excel formula STDEV.S(your selected stock's price changes).
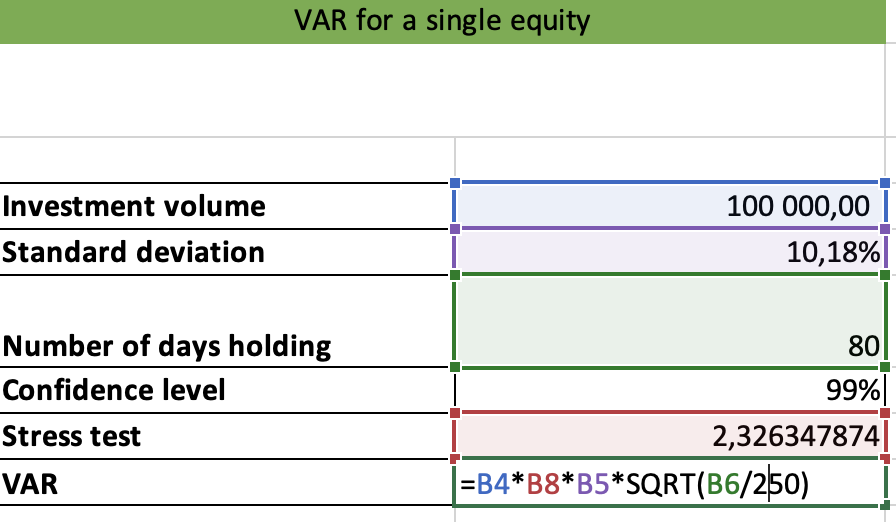
And the VAR formula for a single stock in the print screen below.
It is one of the most straightforward formulas.
VAR = Investment volume * NORMSINV * STDEV * square root of (holding days/number of workdays in a year)
And you will get your result. In my example, the result is 13 402.96 dollars. It is the maximum possible loss I can get if the stock is falling rapidly and if I am planning to hold the stock for 80 days.
It is all that simple. If you don't understand how to calculate the VAR, you can take my course on Udemy, where I explain how to calculate a VAR for a single stock and your portfolio. I give examples and give detailed explanations in Excel. You can find this in the portfolio management section of my course.
Now let's calculate the VAR for the portfolio. The principle is almost the same, but now you must build a variance-covariance matrix. This matrix shows the dependency of each stock in your portfolio on each other and how well they correlate. That is how this matrix looks.
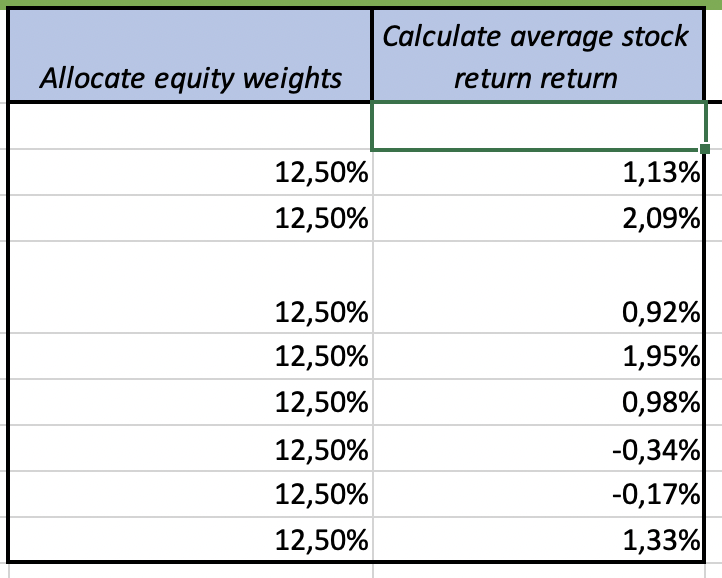
The next step is to distribute stock weights in your portfolio. I don't recommend distributing equal weights. Use portfolio management models to distribute stock weights. For example, you can use the Markowitz model or my web-based app, Diversset, to find great stocks and construct your efficient portfolio. Diversset will automatically distribute stock weights in the portfolio so that you get the lowest possible expected loss, given your required return. After you find stock weights, calculate average stock returns for the period. If you have ten stocks in your portfolio, calculate the daily return of each stock for the yearly period and then calculate the average return for that yearly period. After you have finished your calculations, your screen should look similar to mine.
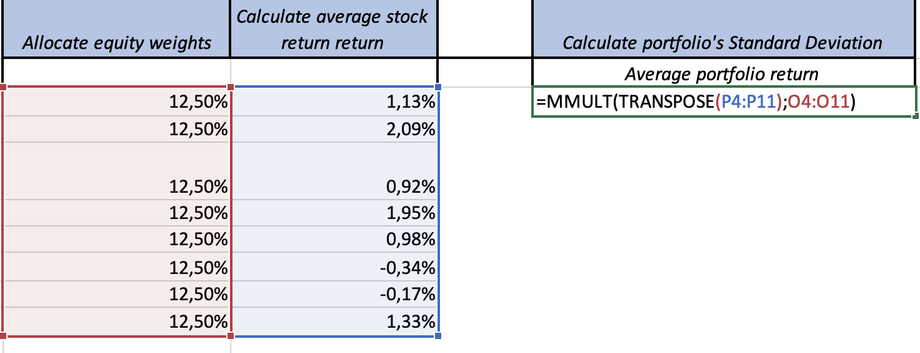
The next step is to calculate the average portfolio's historic return. The return is based on the portfolio's stock weights, and individual stock returns you calculate from the previous step. I am using Excel for my calculations.
The formula is MMULT(TRANSPOSE(stock returns); stock weights)
See the print screen below to understand the procedure.
The next step is to calculate the portfolio's standard deviation—this time, you consider your variance-covariance matrix and stock weights. The excel formula for these calculations looks like this.
SQRT(MMULT(MMULT(TRANSPOSE(stock weights);variance-covariance matrix);stock weights))
Look at the print screen to understand how to use the formula and what you should put inside.
We are approaching the final steps. The next step is to calculate the riskless volume. That is the amount of your investment that is not in danger if your portfolio sharply declines. To do this, you use the formula in excel.
NORM.INV(0,01;(1+portfolio’s return)*invested amount; portfolio standard deviation*investment amount)
After you finish this step, subtract your investment amount from this riskless volume, and you will get your VAR. That will be the maximum loss on your portfolio if it starts declining rapidly.
I hope you liked my explanations and everything was clear. If not, don't hesitate to contact me at skobzhan@diversset.com or purchase my 11-hour financial management course on Udemy. I cover many great topics, including equity valuation, bond valuation, risk management, portfolio management, and trading.


