In this growing real-time digital world, digital dashboard reporting has improved operational intelligence, increased efficiency, and high levels of user engagement. Approximately 75% of the world's population believes that visual interpretation is the most prominent approach when understanding anything. The dashboard has emerged as a tool to enhance operational intelligence, but adoption does not always lead to optimized usage.
The digital dashboard provides an opportunity for the organization to show the data in a systematic manner so that executives can make appropriate decisions for the company. In this article, we are going to explain how an interactive dashboard helps organizations understand things better.
What are dashboards?
Dashboards represent various important pieces of information or data that can be viewed on a screen in the form of panels. However, this dashboard fails to present full capability only when it is not configured to display meaningful key performance indicators (KPIs) or restricted to display information only without the ability to interact with the data.
What are the benefits of a dashboard?
Dashboards are important because they convert your business data into a valuable graphical presentation that makes users to act quickly for business well-being.
Quick and accurate decision making: The dashboard helps many executives, managers, analysts to access the key performance metrics dashboard that helps them monitor business performance and understand business insights for better decision making.
Early Identifications of problem: The dashboard helps the user to identify any problems if present at an early stage and to analyze the data in real time to determine the root cause and correct the negative outlook.
On-demand business preferences: The main purpose of the business dashboard for the user is to check the progress of the business goals. It keeps everyone focused and informed. The user may be able to switch the dashboard according to business preferences.
What is an Interactive Dashboard?
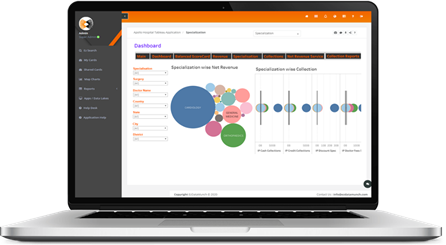
An interactive dashboard is a data management tool that lets you drill down and filter data so that the user can get a dashboard view option from different perspectives and more details. The interactive dashboard includes many features for the user like drill-down interaction with your chart, indicators, and tables and display sub tables, zoom in and out of charts, move time scales, group by months, quarters, years all in a single click.
How to make interactive dashboard?
Basically, the interactive dashboard allows the user to quickly act on the data to create or assign tasks or to easily apply filter reports to easily understand business conditions and take immediate action. But this only works if the dashboard contains all interactive elements. Below are some tips for creating an interactive dashboard.
Flexible and customizable dashboard:
Your dashboard should be flexible and customizable so that you can tailor your analysis results in an interactive way. There should be an option to customize your diagrams, tables, diagrams as per your business requirement. This helps the user to always get effective and efficient BI reports.
Easy to build:
With the establishment of self-service BI, company employees can easily build their own interactive dashboards without the requirements of former BI teams. These sophisticated tools make it easier for companies to create a data-driven and transparent corporate culture.
With EzInsightsai you can easily create an interactive dashboard and instantly share it with selected recipients.
Real-Time & Mobile Friendly
The maximum time users are carrying a mobile phone with them. Therefore, it is necessary to make BI dashboards mobile-friendly so that they can take decisions from anywhere. With mobile-friendly BI dashboards, users can collaborate with the entire company and share dynamic reports to individual users to make better decisions.
Top 6 Interactive Dashboard Features:
Take your data to the next level of insight by providing these powerful features in your dashboard that will boost your dashboard's report to work.
Dashboard click and filter:
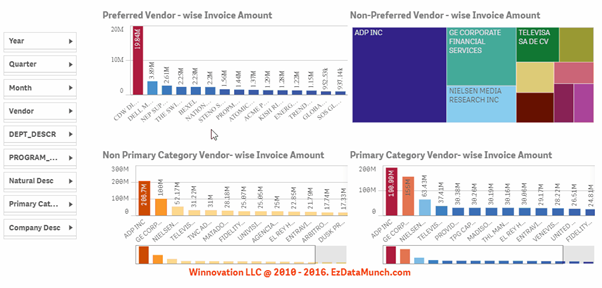
A powerful interactive dashboard provides several ways to segment data and locate your data across a wide range of search hidden insights. This feature allows to dimensions of the dashboard’s charts and graphs as temporary filter values. Just click on a column in a bar chart and filter the table see the visualization to next level.
Reporting and Drill-down:
Drill-down is a powerful feature of the creation of interactive dashboards that only show you detailed information, more specific and additional information for elements, variables, or KPIs that you have selected.
Easy Navigation:
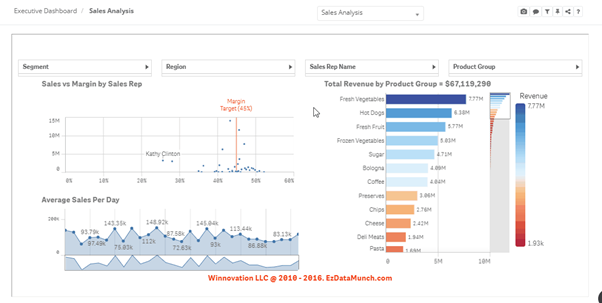
Building navigation between dashboards helps the user to easily switch between sheets. Users can click on navigation menus, buttons, group of buttons, charts, indicators and images for navigations.
Provide time interval widget:
Another built-in interactive dashboard feature that you should see is a time interval widget. These widgets allow you to increase different time scales on different charts on your dashboard with an interactive drill-down function.
Zooming Chart:
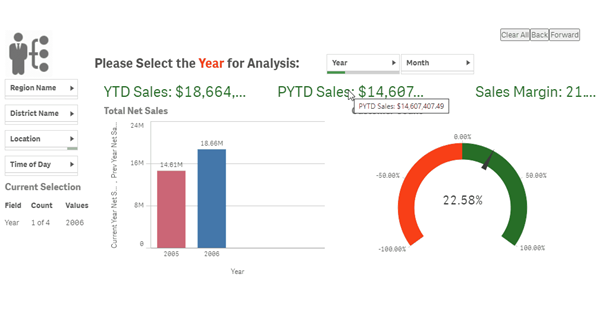
Zooming allows users to select and zoom in on an area of the chart by clicking and dragging them around the enlarged area. The chart can also be performed by zooming in, zooming out, or right-clicking to bring up the context menu to view the entire chart. They can be enabled on x-, y-, and / or extra axes, and are especially useful on charts with larger datasets.
Custom chart tooltip:
This is characterized by the growth of an interactive dashboard. Tooltips are the labels that appear on the user chart to view data points. It may also include some additional information if it is defined by tool-tip settings.
Conclusion
The organization is seeking tools that make reporting built-in and instant. EzInsights helps businesses run real-time interactive dashboards. With the many benefits gained from adopting interactive dashboards, now is the time to empower your business to make better decisions. Start your EzInsights free trial and you can have an experience how easy to create your first chart and dashboards in a minute.

