What does The Koppen Climate Classification System look like in a century?
The Koppen-Geiger system[1] classifies climate into five main categories and 30 sub-categories. The classification is based on threshold values and seasonality of monthly air temperature and precipitation. The five main categories are:
- A (tropical)
- B (dry)
- C (temperate)
- D (continental)
- E (polar)
The nomenclature to differentiate between individual climates is:
- Each main category and sub-category is represented by a letter.
- All climates are assigned a main category (the first letter).
- All climates except for those in the E group are assigned a seasonal precipitation sub-category (the second letter). For example, the letter “s” in the climate Csa (shown below) captures the seasonal precipitation in the “temperate climate” (C denotes temperate).
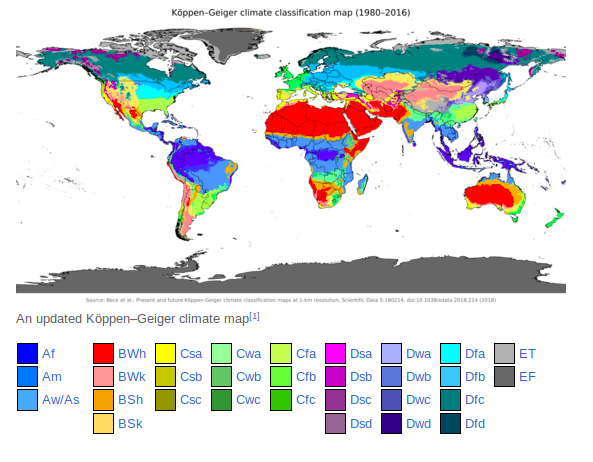
Image source - Köppen climate classification - Wikipedia
- A temperature sub-category is assigned to each of the individual categories, except for those belonging to category A. The third letter in categories B, C, and D and the second letter in E indicate “temperature(s)” pertinent to those climates.
You can read Köppen climate classification - Wikipedia for further insights and relevant examples.
Note - Results of any predictive model must be accepted with a pinch of salt.
Many predictions have been made using this model which have also been constantly discoursed upon, and updated. I think the best way to answer your question is to state the latest results. This paper[2] presented in the revered “Nature”,[3] may very well help the cause. The paper presents the Koppen-Geiger classifications for this century.
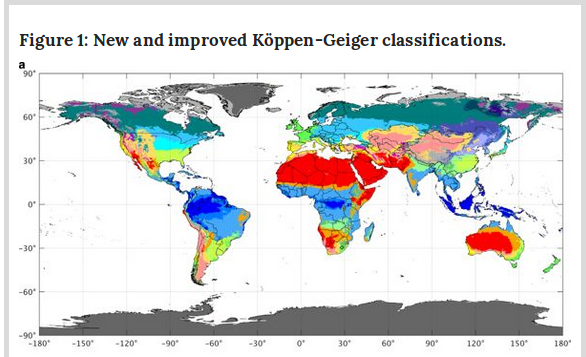
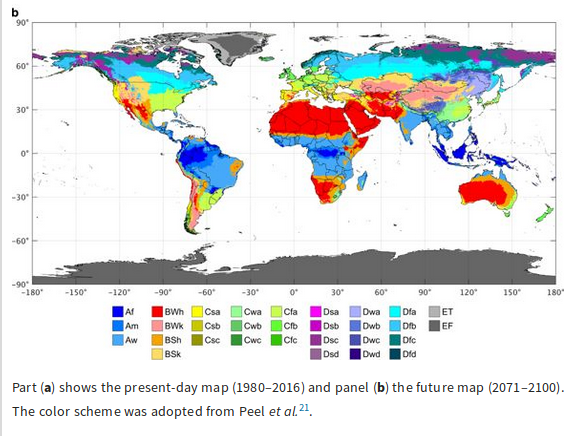
Image Source - Present and future Köppen-Geiger climate classification maps at 1-km resolution
The authors also state an admonition to the reader regarding the results.
The future Köppen-Geiger classification (Fig. 1b) should be viewed as providing insights into potential spatial changes in regional climatic zones under climate change. However, caution should be exerted not to equate those changes directly with changes in actual biomes. First, vegetation changes by 2100 may lag the change in climate zones. Secondly, factors not accounted for in the Köppen-Geiger classification, such as higher atmospheric CO22levels, may alter the relationship between climate classes and vegetation. It is thus advised to interpret the future Köppen-Geiger classification first and foremost from a ‘climatic conditions’ perspective.
The rationale for using the anomaly method to build future maps using climate model projections, instead of directly computing present and future maps from model outputs, is that superimposing future modeled anomalies onto the observed climate removes mean biases from climate model outputs. This is a widely used method in climate change impact assessments [32]. However, an unavoidable limitation of this approach is that because of model spatial biases, modeled climate change anomalies may not be fully geographically consistent with the baseline observed climatology to which they are added [37] (e.g., if the climate of one region in a given model is spatially shifted relative to reality).
Another irredeemable limitation is that because of their coarser resolution (typically 1–2°), climate model outputs do not resolve future climate change at the same scale as our baseline climatology. Thus, in cases where there could be significant heterogeneities in precipitation change and/or warming below the model resolution (e.g., along coastlines and/or in regions with strong land-cover differences and/or elevation gradients), future changes at the 1-km scale might be under- or over-estimated, because only the model-scale mean anomalies are used to compute future changes. High-elevation mountainous regions are a prime example of this because they are expected to experience considerably more warming than adjacent valleys [38].
Footnotes