Cet article s’appuie sur des données et des recherches présentées dans notre article sur la pollution par les plastiques . Un résumé des diapositives sur les plastiques mondiaux est disponible ici .
Dans notre article complet sur la pollution par les plastiques, nous fournissons un aperçu détaillé de la production, de la distribution, de la gestion et des impacts du plastique dans le monde au moyen de visualisations de données et d'explicateurs. Vous devriez y trouver la plupart des données et le contexte nécessaires pour comprendre le problème des plastiques au niveau mondial.
Cependant, après avoir travaillé avec la chaîne YouTube Kurzgesagt - In a Nutshell , pour sa vidéo sur les plastiques et son AMA (Ask Me Anything) sur les plastiques chez Reddit , il est clair que les gens ont de nombreuses questions brûlantes sur le sujet. Ici, je tente de répondre / clarifier certaines des questions les plus fréquemment posées qui ne sont pas directement couvertes dans notre entrée principale.
En cliquant sur l'une des questions ci-dessous, vous obtiendrez la réponse:
Combien de plastique et de déchets produisons-nous?
Quelle quantité d'huile utilisons-nous pour fabriquer du plastique?
Quels secteurs utilisent le plus de plastique?
D'où provient le plastique dans l'océan?
Quels sont les impacts environnementaux des décharges?
Quels sont les impacts environnementaux de l'incinération?
Recyclage, mise en décharge ou incinération: que devrions-nous choisir?
Quelle quantité de déchets plastiques mondiaux est recyclée?
Mon recyclage peut-il se retrouver en décharge?
Est-ce vraiment utile de séparer le recyclage à la maison?
Tous les types de plastique sont-ils également faciles à recycler?
Combien de fois le plastique peut-il être recyclé?
Combien de temps faut-il au plastique pour se décomposer?
Peut-on utiliser du plastique biodégradable à la place?
Les alternatives en plastique sont-elles meilleures pour l'environnement?
Les déchets plastiques affectent-ils la faune?
Le plastique affecte-t-il la santé humaine?
Les pailles en plastique sont-elles un gros problème?
Que puis-je faire si je veux arrêter la pollution plastique des océans?
Peut-on enlever le plastique déjà dans l'océan?
Est-il vrai que certains types de vers peuvent décomposer le plastique?
Existe-t-il des types de bactéries capables de dégrader le plastique?
Combien de plastique et de déchets produisons-nous?
En 1950, le monde ne produisait que 2 millions de tonnes par an. En 2015, la production annuelle avait presque été multipliée par 200 pour atteindre 381 millions de tonnes. Pour le contexte, cela équivaut à peu près à la masse des deux tiers de la population mondiale. 1 Entre 1950 et 2015, la production cumulée a atteint 7,8 milliards de tonnes de plastique, soit plus d'une tonne de plastique pour chaque habitant vivant aujourd'hui.
Combien de déchets produisons-nous? Sur une base annuelle, ceci peut être compliqué par le fait que des matières plastiques de plus longue durée (par exemple, des articles en plastique dans la construction, les meubles, le transport, etc. utilisées pendant plusieurs années) peuvent entrer dans le flux de déchets. Par exemple, en 2010, la production de plastique primaire s'élevait à 270 millions de tonnes alors que celle de déchets plastiques s'élevait à 275 millions de tonnes (depuis que les plastiques produits les années précédentes sont entrés dans le flux de déchets). Nous décrivons cela de manière détaillée dans notre article complet sur la pollution par les plastiques .
Dans notre article, nous fournissons des visualisations de données et des explications sur les déchets plastiques par pays , déchets plastiques par personne , et surtout sur la pollution plastique (en particulier des océans) et les déchets mal gérés par pays et par région . Globalement, les déchets plastiques par personne sont généralement les plus élevés dans les pays à revenu élevé . Cependant, les pays riches ont tendance à disposer de systèmes de gestion des déchets efficaces, ce qui signifie que les déchets mal gérés sont peu nombreux. La plupart des déchets mal gérés ont tendance à provenir de pays à revenu faible à moyen où des populations côtières importantes et une industrialisation rapide empêchent les systèmes de gestion des déchets de suivre le rythme.

Quelle quantité d'huile utilisons-nous pour fabriquer du plastique?
Les estimations varient selon les sources mais tendent à converger entre 4 et 8% de la consommation mondiale de pétrole. 6% de la consommation mondiale de pétrole est prise comme estimation à mi-parcours. 2
D'où provient le plastique dans l'océan?
On estime qu'environ trois pour cent des déchets plastiques mondiaux entrent chaque année dans les océans. 3 En 2010, cela représentait environ 8 millions de tonnes .
Pour comprendre la provenance du plastique entrant dans les océans, nous nous intéressons principalement aux déchets mal gérés des populations côtières. Les déchets mal gérés sont des plastiques qui sont éliminés dans des décharges ou des décharges à ciel ouvert, jonchés ou autrement éliminés par des moyens pouvant se répandre dans l'environnement. Les déchets mal gérés ont tendance à être nettement plus élevés dans les pays à revenu faible à moyen où les systèmes de gestion des déchets sont moins efficaces. Regroupés par région, nous constatons qu'en 2010, 60% des déchets de plastique mal gérés provenaient de l'Asie de l'Est et du Pacifique; 11% d'Asie du Sud; 9% d'Afrique subsaharienne; 8% du Moyen-Orient et d'Afrique du Nord; 7% d'Amérique latine; 3 à 4% d'Europe et 1% d'Amérique du Nord.
Les apports des rivières sont une source importante d'apports de plastique dans l'océan. Nous voyons également ici une forte domination régionale. Les 20 rivières les plus polluantes représentaient plus des deux tiers (67%) des apports fluviaux annuels mondiaux. Géographiquement, nous constatons que la majorité des 20 plus grands fleuves sont situés en Asie. 86% des apports fluviaux provenaient d'Asie; 8% d'Afrique; 5 d'Amérique du Sud; et l’Europe, l’Amérique du Nord et l’Australie-Pacifique combinées ne dépassaient guère 1%.
Cette question est largement traitée dans notre article complet sur la pollution par les plastiques . Vous pouvez trouver ces visualisations de données ici .

Quels secteurs utilisent le plus de plastique?
L’emballage est l’utilisation sectorielle dominante des plastiques dans le monde, représentant 42% (146 millions de tonnes) en 2016. Elle est suivie de la construction avec 19% (65 millions de tonnes). Vous pouvez voir l'utilisation du plastique dans les principales catégories de secteur ici .
Étant donné que les emballages ont généralement une durée de vie beaucoup plus courte que d'autres produits (tels que la construction ou les textiles), ils sont également dominants en termes de production annuelle de déchets. Il est responsable de près de la moitié des déchets plastiques mondiaux - la ventilation par secteur est illustrée dans le graphique ci-dessous.
Nous couvrons cette question plus en détail dans notre article sur les plastiques , que vous trouverez ici.

J'ai entendu dire que la plupart de nos débris de plastique océanique provenaient d'activités de pêche. Est-ce vrai?
En résumé, les meilleures estimations suggèrent qu'environ 80% des plastiques océaniques mondiaux proviennent de sources terrestres et les 20% restants d'origine marine. Les activités marines sont dominées par les activités de pêche, notamment les filets mis au rebut, les lignes de pêche et les navires abandonnés.
S'il s'agit de la contribution relative en tant qu'agrégat de plastiques océaniques globaux, la contribution relative de différentes sources variera en fonction de la localisation géographique et du contexte. Par exemple, on estime que les lignes en plastique, les cordages et les filets de pêche représentent 52% de la masse de plastique dans le «Great Pacific Garbage Patch» (GPGP) (et représentent 46% de la composante mégaplastique du GPGP). 5 La contribution relative des sources marines ici devrait probablement résulter de l'intensification des activités de pêche dans l'océan Pacifique.
Nous couvrons cette question plus en détail dans notre article sur la pollution par le plastique, que vous trouverez ici .
Quels sont les impacts environnementaux des décharges?
Une option de traitement des déchets plastiques consiste à les envoyer en décharge. Ici, il est important de faire la distinction entre la qualité et l’efficacité des décharges.
La définition moderne d'un site d'enfouissement est un site d'élimination de matériaux par enfouissement. C'est généralement le cas dans les pays à revenu élevé où les décharges sont bien gérées et réglementées efficacement. Cependant, dans de nombreux pays, les ressources des sites d'enfouissement peuvent aujourd'hui être mal gérées; dans de nombreux cas, déversés dans des décharges, des fosses ou des décharges à ciel ouvert. Ces installations d'élimination incontrôlées peuvent rendre les plastiques vulnérables à la pollution de l'environnement et aux risques de pénétration dans l'océan.
Les sites d'enfouissement bien gérés s'attendent à collecter, compacter et stocker en toute sécurité les déchets. Dans de nombreux cas, il s’agit de recouvrir ou d’enterrer des sols ou d’autres matériaux. Cependant, ces décharges ont toujours des impacts environnementaux négatifs:
Gaz à effet de serre : lorsque les matières organiques se décomposent pour produire du méthane (CH 4 ) et du dioxyde de carbone (CO 2 ) - tous deux sont des gaz à effet de serre qui contribuent au changement climatique. Dans certains sites d'enfouissement, le méthane peut être capturé et «brûlé» (brûlé) pour la production d'énergie. Le plastique, qui est difficile à décomposer, se dégrade sur de très longues périodes (en particulier dans des conditions de manque d'oxygène) ne contribue pas à cet effet.
Lixiviat : le matériau en décomposition peut produire des eaux riches en éléments nutritifs ou polluées qui, si elles ne sont pas correctement confinées, peuvent être lessivées dans le milieu environnant et éventuellement pénétrer dans les cours d'eau et les sols. Les sites d'enfouissement bien gérés sont généralement entourés d'un revêtement protecteur afin d'empêcher toute infiltration d'eau dans l'environnement. Cependant, une pollution locale peut se produire si elle n'est pas mise en œuvre efficacement ou si la doublure tombe en panne et n'est pas remplacée.
Lorsque les plastiques ne sont pas manipulés correctement, certains types de plastique - tels que le polychlorure de vinyle; Le PVC - peut lixivier des produits chimiques tels que des additifs et des composés plastifiants. 6Un rapport de la Commission européenne visait à fournir une analyse détaillée et une vue d'ensemble des preuves disponibles sur le comportement du PVC dans les décharges. 7 L'étude a conclu que si le lixiviat des substances comme étant soit non détectable ou à des concentrations très faibles, une approche de précaution considérerait ce matériel ne contrôlable si les décharges sont équipées avec un revêtement adéquat et le traitement des lixiviats.
Quels sont les impacts environnementaux de l'incinération?
L'incinération est la combustion d'un matériau donné - dans le cas du plastique, cela se fait à des températures très élevées. L'incinération est une forme de gestion des déchets. Quels sont les impacts environnementaux de l'incinération?
Gaz à effet de serre : l'incinération de plastique produit du dioxyde de carbone (CO 2 ) , l'un des principaux facteurs du changement climatique mondial. Cependant, le processus d'incinération peut être intégré en tant que solution «Waste to Energy» (WtE). WtE est une forme de récupération d'énergie; dans ce cas, l'énergie des plastiques peut être stockée et utilisée comme énergie. Au bilan net, l’incinération at-elle donc un impact net positif ou négatif sur les émissions de gaz à effet de serre?
Ça dépend. Les gains relatifs liés à la récupération d'énergie varient en fonction de l'efficacité du processus d'incinération et du mélange de sources d'énergie qu'il remplace. Dans les pays où le mix énergétique est dominé par les combustibles fossiles, la récupération d'énergie par incinération peut réduire les émissions. Cependant, dans de nombreux pays - la plupart en Europe - où l'efficacité de l'incinération est faible et où le mix énergétique est pauvre en carbone, cela constitue une source nette d'émissions de gaz à effet de serre. 8
Pollution de l'air : l'incinération a pour préoccupation commune de dégager des émissions toxiques dans l'environnement proche. La combustion de plastiques peut produire plusieurs gaz toxiques: une combustion incomplète du polyéthylène (PE), du polypropylène (PP) et du polystyrène (PS) peut libérer du monoxyde de carbone (CO) et des émissions nocives, tandis que le chlorure de polyvinyle (PVC) peut produire des dioxines. 9 , 10 De tels gaz peuvent être toxiques et dangereux pour la santé de l'homme et de l'écosystème. Il est donc fortement déconseillé de brûler des matières plastiques à l'air libre ou sans contrôle.
Est-ce également le cas dans les installations d'incinérateur? Cela dépend en grande partie de l'efficacité et du contrôle environnemental des émissions du site de l'incinérateur. Dans les pays à revenu élevé en particulier, les sites de gestion des déchets et des incinérateurs sont fortement réglementés et permettent de surveiller les émissions et les fuites potentielles dans l'environnement. Les incinérateurs modernes ont largement traité le problème des émissions de dioxines et autres toxines. Les technologies utilisées ici incluent une combustion efficace, un traitement en bout de chaîne, une réduction catalytique sélective et l’ajout d’inhibiteurs appropriés. 11 Une étude réalisée en Belgique, par exemple, n'a révélé aucune différence entre les concentrations sériques de dioxine chez les ouvriers d'entretien des installations d'incinérateurs de déchets municipaux -les personnes qui auraient des taux d'exposition élevés si de telles méthodes n'étaient pas mises en œuvre. 12
Toutefois, ces technologies et normes relatives à l'incinérateur ne sont pas appliquées partout - dans les pays où la réglementation environnementale est moins stricte, la combustion à l'air libre ou à l'air libre des déchets municipaux reste courante. Cela se produit généralement dans les pays à revenu faible à intermédiaire. Des études menées en Inde, au Kenya et en Thaïlande, par exemple, font état d'une pollution notable due à la combustion de déchets (y compris la génération de dioxines). 13 , 14 , 15Pour que l'incinération devienne une solution universellement sûre, des normes et l'adoption de technologies et d'approches appropriées doivent être adoptées à l'échelle mondiale.
Recyclage, mise en décharge ou incinération: que devrions-nous choisir?
Il existe trois options principales pour la gestion des déchets plastiques: le recyclage, l’incinération ou l’enfouissement. 16 Que devrions-nous choisir?
Ce qui semble être une simple question peut parfois être complexe. Les opinions diffèrent selon les problèmes environnementaux, de santé ou économiques auxquels on se soucie. L'impact de différentes méthodes peut être évalué à l'aide de multiples facteurs, notamment les émissions de gaz à effet de serre, l'utilisation d'énergie, la pollution locale et le coût de traitement.
Dans le tableau ci-dessous, nous présentons les résultats synthétiques d'une méta-étude sur la comparaison entre le recyclage (R), l'incinération (I) et la mise en décharge (L) des plastiques. 17 Ceci résume les conclusions d’une série d’études spécifiques à un lieu évaluant le potentiel de réchauffement global relatif (PRP) et la consommation totale d’énergie (EVP) des trois méthodes. Chacune est montrée de l'impact le plus faible à l'impact le plus élevé (par exemple, R <L <I signifie que le recyclage a l'impact le plus faible, suivi de la mise en décharge, puis de l'incinération, du plus fort).
| Référence | Matériel / application | Potentiel de réchauffement planétaire (PRP)
|
Utilisation totale d'énergie (EVP)
|
|---|---|---|---|
| Arena et al.2003 | Contenants de liquides PE et PET | RLI | RIL |
| Beigl et Salhofer 2004 | Emballage plastique | RI | - |
| Chilton et al.2010 | ANIMAL DE COMPAGNIE | RI | - |
| Craighill et Powell 1996 | PET, HDPE et PVC | RL | - |
| Dodbiba et al. 2008 | Plastiques (PE, PS et PVC) | RI | - |
| Eriksson et Finnveden 2009 | Plastique non recyclable | IL | - |
| Eriksson et al. 2005 | PE PE, PP, PS et PET |
RIL RIL |
RIL RIL |
| Finnveden et al. 2005 | PVC PE, PP, PS, PET et PVC |
R = IL ILR |
RIL IRL |
| Foolmaun et Ramjeeawon 2013 | ANIMAL DE COMPAGNIE | RLI | RIL |
| Grant et al.2001 | PET, HDPE ET PVC | RL | RL |
| Moberg et al. 2005 | ANIMAL DE COMPAGNIE | RIL | RIL |
| Mølgaard 1995 | Plastiques plastiques |
- - |
RIL ILR |
| Perigini et al.2004 | Contenants de liquides PE et PET | RLI | RIL |
| Perigini et al.2005 | Contenants de liquides PE et PET | RLI | RIL |
| Rajendran et al. 2013 | Plastiques | RI | - |
| US EPA 2006 | HDPE, LDPE et PET | RLI | RIL |
| Wenisch et al. 2004 | Plastiques | R = L | - |
| Wollny et al.2001 | Emballage plastique | RLI | RIL |
| M. Al-Maaded et al. 2012 | Matières plastiques non spécifié Plastics |
RL RLI |
- RIL |
| Shonfield 2008 | Plastiques | ILR | - |
Le recyclage avait le potentiel de réchauffement planétaire et la consommation d’énergie les plus faibles de presque toutes les études. D'un point de vue environnemental, le recyclage est généralement la meilleure option. Cela est généralement vrai, mais notez qu'il y a quelques mises en garde:
- Ceci est basé sur l'hypothèse que le matériau recyclé représente un déplacement un pour un de la production de plastique primaire, c'est-à-dire que chaque tonne de matériau recyclé empêche la production d'une tonne de matériau primaire. Par contre, ce n'est pas toujours le cas. Les processus de recyclage peuvent souvent conduire à des produits de qualité et de valeur économique inférieures - souvent appelés «recyclage». Cela signifie que nous ne pouvons pas prendre pour acquis que cette substitution à la production primaire est un à un. 18
- une grande partie du plastique que nous recyclons ne peut être recyclé qu'une ou deux fois (nous répondons ici ). Ensuite, il finira dans une décharge ou incinéré. Cela signifie que même si le recyclage est la meilleure des trois options de gestion, ce n'est pas une solution miracle. Le recyclage ne fait que retarder - plutôt qu'empêcher - l'élimination dans une décharge ou une incinération.
- Bien que le recyclage présente des avantages évidents pour l’environnement, ce n’est pas toujours le choix le plus économique. La rentabilité relative entre le recyclage et la production de nouveau plastique est fortement déterminée par les prix du pétrole. Lorsque les prix du pétrole sont bas, il peut être moins coûteux de fabriquer des plastiques bruts que de les recycler. Par exemple, lorsque les prix du pétrole brut étaient bas en 2015-2016, l'industrie du recyclage a eu du mal à concurrencer la production de matières premières.
Néanmoins, le recyclage en général est la meilleure des trois options.
Mais qu'en est-il du plastique non recyclable ? Devrions -nous l'envoyer au site d'enfouissement ou l'incinérer? Ici, le gagnant est moins net. Comme nous le voyons dans l’ensemble des études ci-dessus: tout dépend du contexte, du type de plastique et des conditions permettant de déterminer si l’enfouissement ou l’incinération ont un impact moindre sur les émissions de gaz à effet de serre ou la consommation d’énergie.
Comme nous le décrivons dans les sections ci-dessus sur les conséquences de la mise en décharge et de l' incinération , les deux présentent des risques environnementaux potentiels s'ils ne sont pas gérés ou réglementés correctement. Le meilleur choix peut dépendre du contexte local. L'incinération, par exemple, peut avoir un impact positif net sur les émissions de gaz à effet de serre si elle est brûlée efficacement et est utilisée dans un bouquet énergétique à dominante de combustible fossile. Dans certains pays, dont beaucoup en Europe, l'efficacité de l'incinération est faible et le mix énergétique est pauvre en carbone 19 , ce qui signifie que la mise en décharge peut être plus favorable. L'incinération peut être favorable lorsque les combustibles fossiles dominent, si l'espace de décharge est limité ou mal géré, ou si les conditions sous la surface du sol sont défavorables aux décharges.
Dans les deux cas, il est essentiel qu'une gestion et une réglementation appropriées soient en place pour minimiser les impacts sur l'environnement.
Quelle quantité de plastique mondial est recyclée?
Nous couvrons cette question plus en détail dans notre article sur les plastiques, que vous trouverez ici . En résumé, on estime qu'en 2015, environ 55% des déchets plastiques mondiaux ont été jetés, 25% incinérés et 20% recyclés. Sur les déchets plastiques produits entre 1950 et 2015, seuls 9% ont été recyclés.

Mon recyclage peut-il se retrouver en décharge?
Malheureusement oui. Certains plastiques destinés au recyclage finissent dans des décharges.
Cela peut se produire pour plusieurs raisons:
- Dans la plupart des pays, une partie des plastiques destinés au recyclage sont finalement rejetés par les installations de traitement des déchets locales ou régionales. La raison la plus commune du rejet de recyclage est la «contamination» des flux de recyclage -Cela peut résulter de fortes concentrations d'éléments non recyclables dans le flux de déchets ou de la contamination d'autres formes telles que les déchets alimentaires. Même dans les cas où la contamination plastique pourrait être traitée, il est parfois plus rentable de détourner certaines charges vers une décharge. Les coûts de traitement des charges de plastique mal triées ou contaminées sont plus élevés, dépassant dans certains cas les profits tirés des matériaux recyclés.Le taux de «recyclage rejeté» peut varier considérablement d'un pays à l'autre en fonction des politiques de recyclage, des objectifs et de l'efficacité des méthodes de recyclage ( au niveau du ménage et de la collecte locale ou des installations de traitement des déchets). Pour une idée de l’échelle, les derniers chiffres Pour l’Angleterre, on estime qu’entre 3 et 4% du recyclage total des ménages (plastiques, mais aussi papier, métaux, etc.)20 En termes relatifs, cette part est relativement faible mais pourrait être améliorée si l’on comprenait mieux comment éviter la contamination des flux de recyclage du plastique.
- As we describe in our full Plastics entry, recycled plastic is a globally traded commodity. The majority of major exporters are high-income countries. If we look at the top ten exporting countries over the period from 1988 to 2016, we see that collectively they account for 78 percent of global plastic exports (as shown in the chart below). All of the top ten exporters are defined as high-income. Collectively, they have exported 168 million tonnes over this period, equivalent to an economic value of US$65 billion. China has been the world's largest plastic importer. Collectively, China and Hong Kong have imported 72.4 percent of all plastic waste (with most imports to Hong Kong eventually reaching China).21 In 2017, China introduced a ban on non-industrial plastic imports in part because of the levels of contaminated plastics in countries' export stream. Some of this imported plastic therefore ended up in landfill (and possibly at risk of entering the ocean).It's challenging to track the ultimate fate of traded plastics, however it's likely that at least some of recycled plastics exported from high-income countries enters landfill in the countries to which they are traded.
- Following China's ban on imported plastic in 2017, previous large exporters such as the United States, Canada, Australia and UK have failed to handle the increase in domestic plastic recycling demand. As such, some materials intended for recycling have subsequently been diverted to landfill.
- Plastics typically degrade in quality during the recycling process. For most recyclable plastics, they are typically only suitable for recycling once. As a result, most recycled plastic we use eventually reaches landfill, even if it goes through an additional use cycle as another product. Recycling typically delays rather than prevents plastic disposal to landfill or incineration.

Is it really helpful to separate recycling at home?
Approaches to recycling differ both between and within countries in terms of handling protocol at recycling centres, as well as guidance for disposal of waste at home. Some localities, for example, have a single mixed recycling disposal bin whilst others have separate bins for plastic, paper, and aluminium/cans. It's therefore difficult to provide universal guidance on the correct approach to separating waste. But there are some key points which apply in most cases.
Many believe that taking care of what they do or don't put into recycling at home is irrelevant — that landfill and recycling are mixed then separated later at waste management facilities. This is false. Landfill and recycling collections are not mixed. If you place recyclables in general waste bins (in localities with designated recycling bins) they will end up landfill.
It's important to be careful about what you place in recycling; non-recyclable plastics can lead to contamination of the supply. Although many facilities have automated and/or manual procedures for removing non-recyclables, they're not always 100 percent effective. If waste loads contain a significant amount of non-recyclables, facilities may deem them non-economic to sort. The same applies to food or liquid waste: unwashed plastics can contaminate the supply. These loads can be sent straight to landfill.
What about the separation of different recyclables (e.g. plastic, paper, and metal cans) — is it necessary to sort these at home? If your locality has only mixed recycling collection (called 'single-stream') then your job is easy. The exception here is glass and batteries — they should be recycled separately. The municipality will collect fully mixed loads and sort them at dedicated facilities using methods such as density separation, magnets and infrared technology. Infrared cameras can be used to determined specific plastic polymer types. You can read an overview of the recycling process by one UK locality here.
Some localities still use 'multi-stream' recycling where you have separate bins for each type of recyclable. But, with evidence that single-stream recycling increases recycling rates, many are turning away from multi-stream.22 If your locality relies on multi-stream recycling then its waste management processes are less likely to separate different types of recycling in waste streams. Ensuring your recycling goes in the correct bin is therefore important.
Are all types of plastic equally easy to recycle?
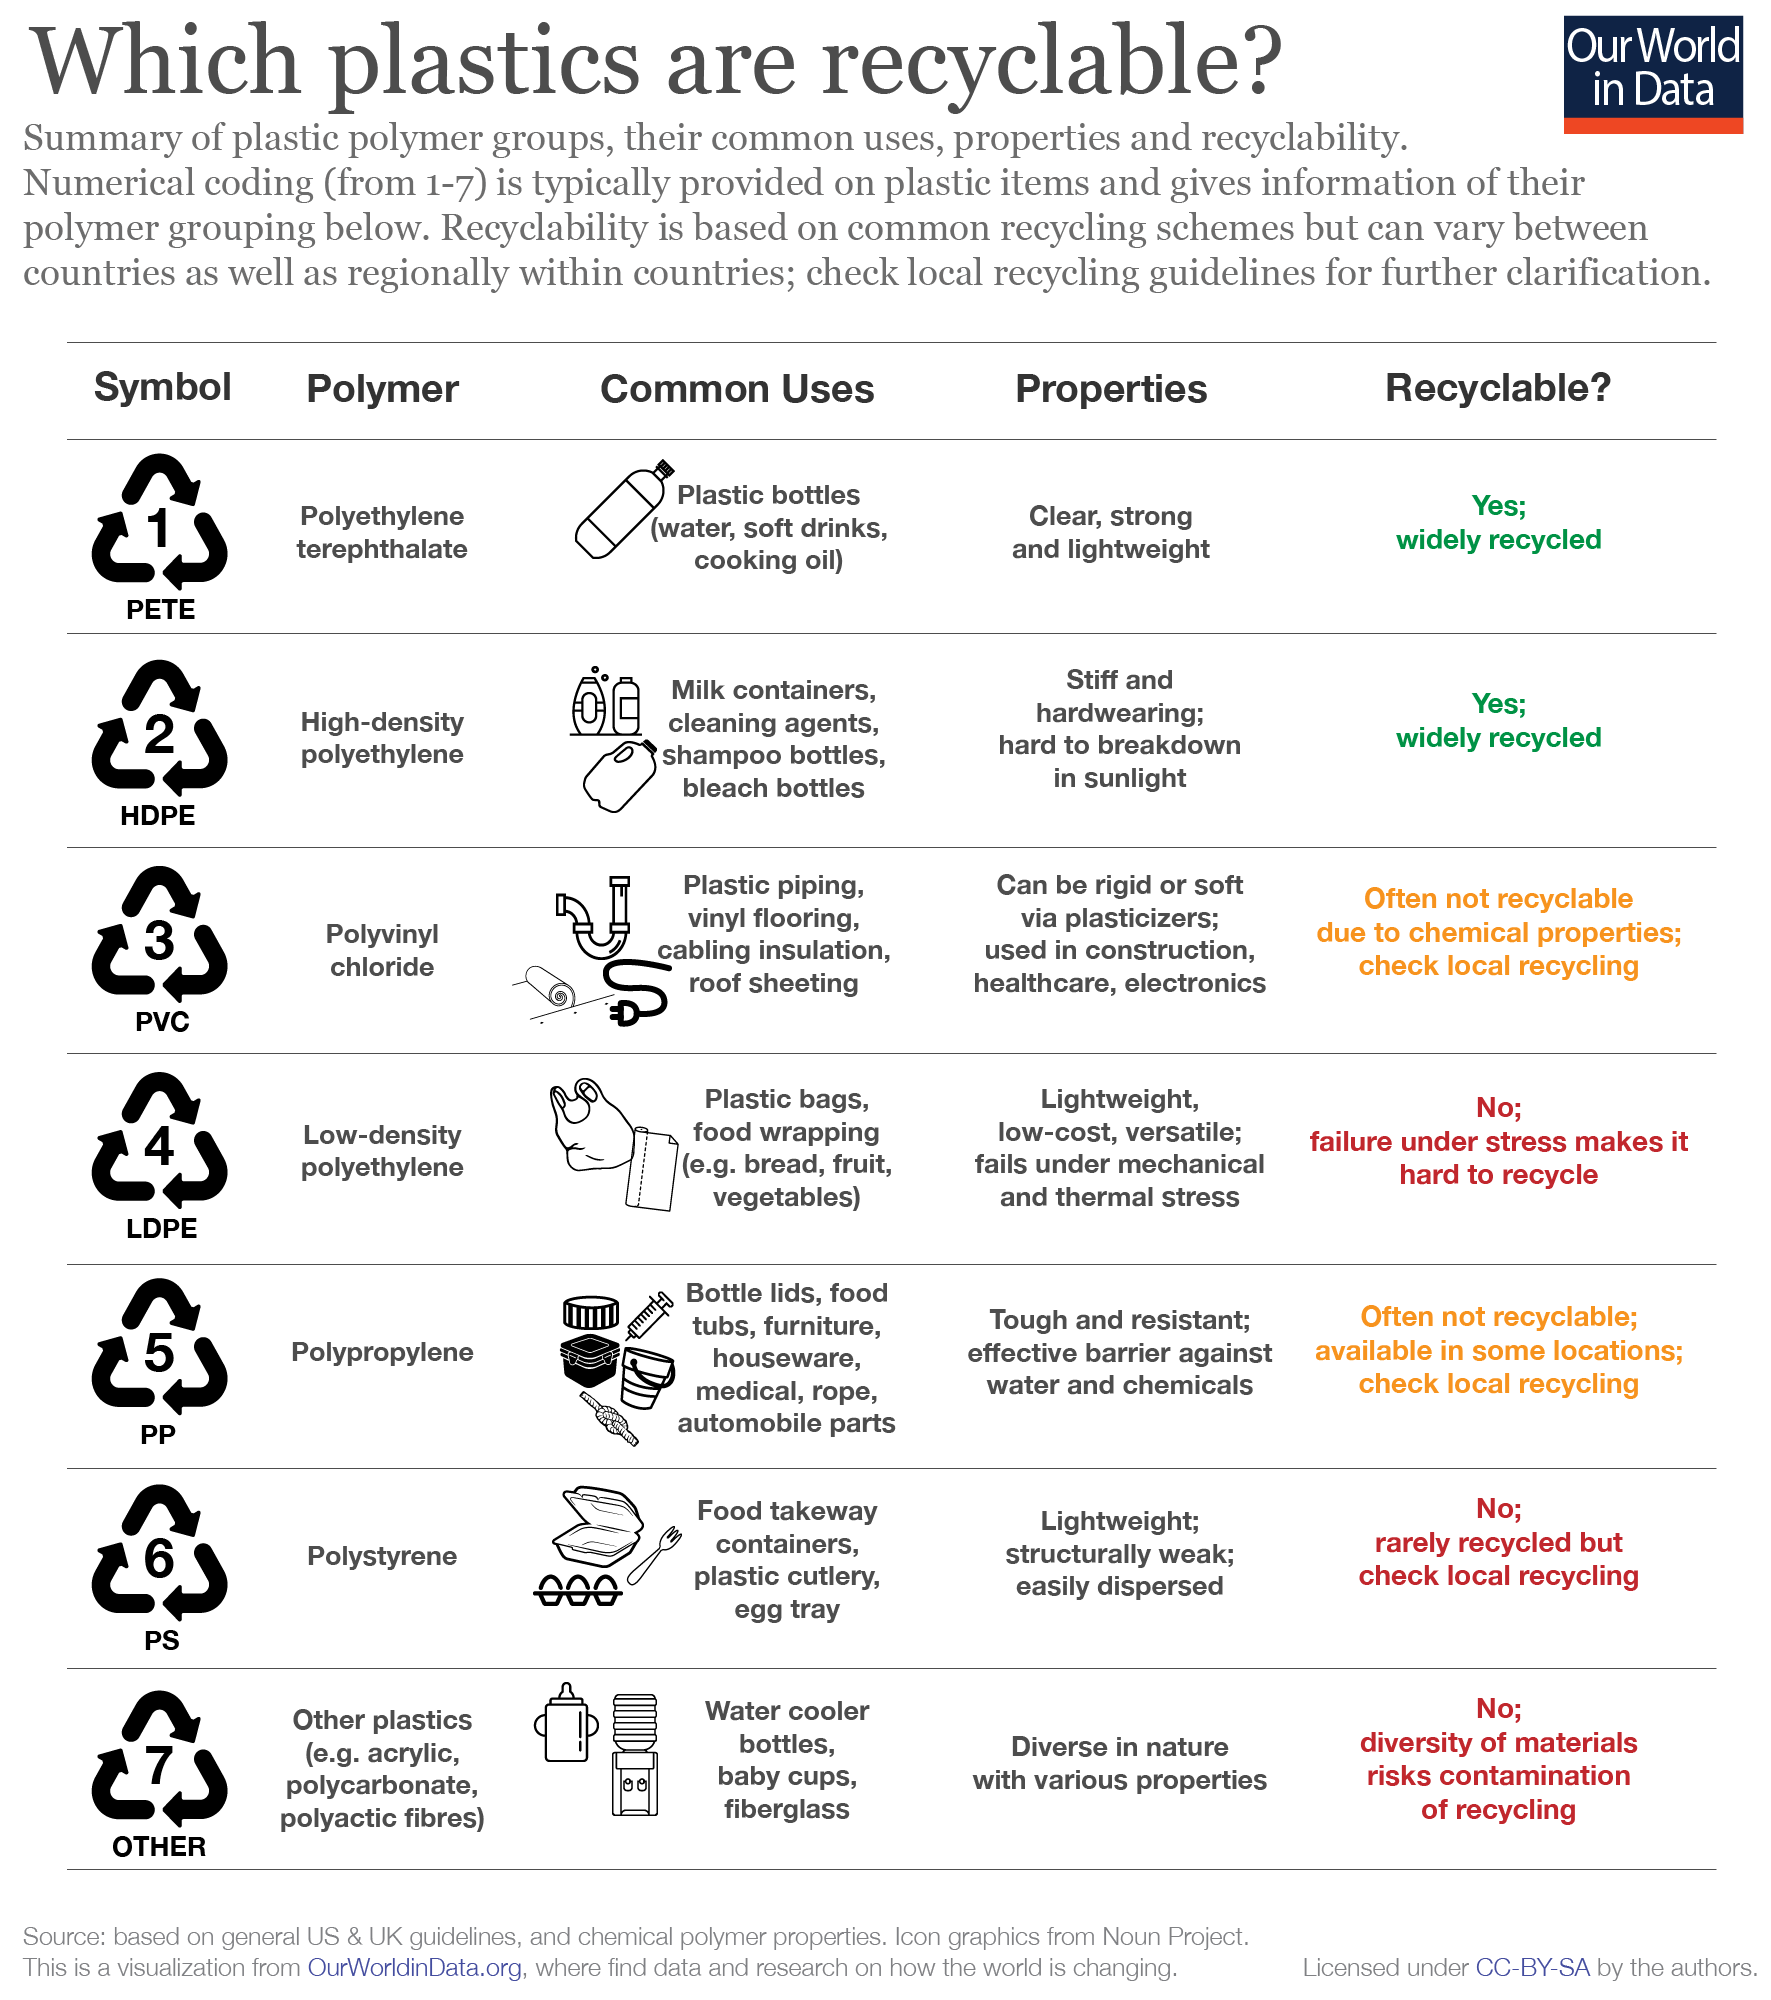
There are a wide range of polymers used in common plastics. Such materials have different properties and are therefore appropriate for different uses. The structure of the polymers also affect a plastic's recyclability. Some polymers fail and break down under mechanical or thermal stress; this affects their ability to be recycled.
In the table below we summarise the key categories of plastics, their common uses, properties and whether they can be recycled or not. Most plastic items have a marked symbol numbered from 1 to 7 (shown below) on them — this should provide some guidance on recyclability. Note that the information below is based on general guidelines for household collection, however, these can vary depending on waste management infrastructure in specific locations. You should check local recycling guidelines for clarification. For example, it used to be the case that most recycling facilities were unable to handle plastic caps/tops from water or soft drink bottles. Some facilities now can, and encourage residents to recycle both together.
In general I try to remember a simple code of: 1 and 2 are recyclable; 3 and 5 sometimes recyclable; 4, 6 and 7 usually not recyclable. One good general source of information of what items are and aren't accepted is available here. You can also search for specific items, where guidance is provided on how to dispose of it properly.
You can view the relative amounts of plastic waste generation by polymer here.
How many times can plastic be recycled?
It's a common misconception that most plastics can be recycled many times over. This belief can allow us to justify high rates of single-use plastics on the basis that they are recyclable and therefore do not end up as waste in landfill.
In practice, the majority of recycled plastics are only recycled once or twice before being finally disposed of in landfill or incineration. In their 2017 Science paper on the fate of global plastics, Geyer et al. (2017) write that "Recycling delays, rather than avoids, final disposal. It reduces future plastic waste generation only if it displaces primary plastic production; however, because of its counterfactual nature, this displacement is extremely difficult to establish."23 The study estimates that of the plastic recycled to date, only 10 percent has been recycled more than once. Following this, they end up in the municipal waste stream.
The limits to repeated mechanical recycling occur because of thermal breakdown/destruction in processing (which can degrade the quality of material) and the mixing or contamination of plastic polymer types means secondary plastics can be of low economic or practical value. When plastics become products of lower quality following recycling, this is often termed 'downcycling'. A 2016 report by the World Economic Forum, the Ellen MacArthur Foundation, and McKinsey & Company, estimated that around 14 percent of plastic packaging globally is collected for recycling, however the costs of sorting and reprocessing mean that only 5 percent of material value is retained for use as further materials.24
In recent years there has been promising progress in the development of polymer materials which can be chemically recycled back to their initial raw materials for the production of virgin plastic production.25 In a recent study, Zhu et al. (2018) successfully synthesised a plastic with mechanical properties similar to commercially available plastics, but with infinite recyclability through chemical recycling. Such methods are currently expensive and unfavourable in terms of energy inputs, but could provide a commercially-viable solution in the years to follow.26
How long does it take plastics to break down?
Many plastics are defined as non-degradable, meaning they fail to decompose and are instead broken down into smaller and smaller particles. Materials can slowly break down through photodegradation (from UV radiation). Estimated decomposition times for plastics and other common marine debris items are shown in the chart below.
Fishing lines, for example, take an estimated 600 years to break down. Plastic bottles take an estimated 450 years.27

Can we use biodegradable plastic instead?
The production of so-called 'bioplastics' or biodegradable plastics is currently very low: estimated at around 4 million tonnes per year (which would be just over one percentof global plastics production).28,29
'Biodegradable' plastic is typically defined as plastics which break down at faster rates than standard plastics. However, this broad definition means the boundary of what constitutes biodegradable plastics is often intensely debated. Biodegradability can in some cases be claimed simply because break down is accelerated (without necessitating fast degradation).
One example of this is ‘oxo-degradable plastics’: plastics (such as polyethylene) with additives which accelerate the oxidation process (causing them to break down faster). In essence, however, all this does is break the plastics down into microplastics.
This has been the case with several so-called biodegradable plastics: they are proven to break down faster under specific environmental conditions (which may not actually reflect the normal environment), but may not be effectively degradable under natural conditions. The labels of 'biodegradable', 'bio-based', 'compostable', are therefore often claimed and used in marketing contexts, with little understanding for consumers on what these definitions mean in practice.
A key current challenge of biodegradable plastics is that they tend to need particular waste management methods which are not always widely available. They usually need to be separated from the traditional recycling stream (which can be difficult and expensive), and have to go to specific compostable facilities. This doesn’t mean such methods are unfeasible, but could be additional economic cost especially if they're in the waste stream at low concentrations, and would take significant work in terms of infrastructure redesign.
In 2015, the United Nations Environment Programme (UNEP) published a report on the misconceptions, concerns and impacts of biodegradable plastics.30 It concluded that: "the adoption of plastic products labelled as ‘biodegradable’ will not bring about a significant decrease either in the quantity of plastic entering the ocean or the risk of physical and chemical impacts on the marine environment, on the balance of current scientific evidence."
Are plastic alternatives better for the environment?
Plastics are undeniably a key environmental concern — particular in terms of impacts to ocean health and wildlife. But it's also important to acknowledge the value plastic plays across many aspects of society. It is a unique material: often lightweight, resilient, usually non-reactive, waterproof and cheap. For most of us, it has an almost constant place in our lives. Even those who try to minimise or cut plastic from their lives are likely to come into contact with it every day.
One example where plastic plays an important role is food packaging. Whilst over-packaging can undoubtedly be a significant issue, packaging of food products is essential for the prevention of food losses, wastage and contamination.31 Storage and packaging plays a crucial role from harvest all the way through to final consumption of the foods we eat. Even if some consider the final phase of packaging (from retail to home) to be unnecessary, it is likely it has played an important role in preserving food from the farm to the retail stage. It protects foods from pest and disease, significantly increases shelf life, and maintains food safety.32
Packaging is sometimes taken for granted in higher income countries. Across many low-to-middle income countries, lack of packaging is an important issue for food security. The UN Food and Agriculture Organization (FAO) emphasise that lack of packaging, storage and refrigeration leads to significant post-harvest losses.33 It notes: "large losses from farm to plate are attributed to poor handling, distribution, storage, and purchase/ consumption behavior. Huge resources that could otherwise be spent on more productive activities go into producing and transporting goods that only go to waste. Losses at almost every stage of the food chain may be reduced by using appropriate packaging."
In fact, studies have shown that when we compare environmental impacts such as greenhouse gas emissions, energy, water and resource use, plastic packaging tends to have a net positive impact. The impact of plastic production and handling is lower than the impacts which would result from food waste without packaging.34,35,36Reducing packaging where it is used in excess is useful, however, abandoning packaging completely would have serious implications for food security, safety, and would ultimately lead to large increases in the environment impact of food.
The question is therefore: is plastic the best material to use for packaging? Which material is 'best' for the environment? As designer and sustainability innovator, Leyla Acaroglu, discusses in her TED Talk 'Paper beats plastic? How to rethink environmental folklore', there is no universal consensus on 'best' or 'worst' materials.37 Materials have different relative impacts across different environmental metrics. This ultimately leads to trade-offs. Some materials may release fewer greenhouse gas emissions but require more water or fertiliser inputs, for example.
There's no simple answer; your choice would be different depending on the environmental impacts you're most concerned about. In general, plastic tends to be cheap and has significantly lower greenhouse gas emissions, energy, water and fertilizer inputs than alternatives such as paper, aluminium, cotton or glass. The obvious environmental detriment is it's pollution of the natural environment when poorly managed. In the charts below we summarise one life-cycle analysis (LCA) study of environmental impacts by grocery bag type. This is based on results from the Danish Environmental Protection Agency.38These figures present the number of times a grocery bag would have to be reused to have as low an environmental impact as a standard LDPE (Low-density polyethylene) single-use plastic bag. For example, a value of 5 indicates a bag would have to be reused 5 times to equal the environmental impact of a standard single-use plastic bag.
This is shown for greenhouse gas emissions only, and for combined environmental impact (including greenhouse gas emissions, ozone depletion, human toxicity (cancer effects), human toxicity (non-cancer effects), photochemical ozone formation, ionizing radiation, particulate matter, terrestrial acidification, terrestrial eutrophication, marine eutrophication, ecosystem toxicity, resource depletion (fossil), resource depletion (abiotic), and water resource depletion).
Results show that some plastic bag alternatives have high environmental impacts, and would require many reuses to make them worthwhile as a substitute. For example, an organic cotton bag would have to be reused 149 times to equal a LDPE's greenhouse gas emissions, and 20,000 when impacts such as eutrophication, water and ecosystem impacts are included. This presents a complex decision: plastic tends to have lower environmental impact for most metrics with the exception of its non-degradability and marine pollution. Our choice is therefore defined by the metrics we hold in highest regard — most of which involves the balancing of trade-offs.


What are microplastics?
Microplastics tend to receive a lot of public and media attention. They are often discussed, or confused, as being a unique and different from conventional plastics.
By definition, microplastic is simply plastic of a very small particle size. When we discuss plastics we sometimes categorise them based on particle size; typical particle size ranges are shown in the table below.39 Microplastics are plastic particles with a diameter typically less than 5 millimetres, or in same scales less than 4.75 millimetres. Even smaller particles, measuring less than 0.0001 millimetres (<0.1μm — micrometre) in diameter are often referred to as nanoplastics.
Microplastic can arise through primary or secondary processes. Primary microplastics are already of a small size in production: common sources include fibres, pellets, microbeads, and capsules. Secondary microplastics form from the breakdown of larger plastic products. For example, when meso- or macroplastic particles are exposed to the natural environment (for example in rivers, ocean waters, sunlight), physical or ultraviolet (UV) weathering can occur, which degrades them into smaller particles.
One challenge of microplastics is that their small size makes them easier to (consciously or not) ingest. Ingestion of microplastics could have detrimental impacts on wildlife health. The small size of these particles make them difficult to track and monitor; evidence on the impacts and behaviour of microplastics are therefore currently very limited.
| Particle category | Diameter range
(mm = millimetres) |
| Nanoplastics | < 0.0001 mm (0.1μm) |
| Small microplastics | 0.0001 - 1 mm |
| Large microplastics | 1 - 4.75 mm |
| Mesoplastics | 4.76 - 200 mm |
| Macroplastics | >200 mm |
Does plastic waste impact wildlife?
Yes, there are many reports and documented cases of the impact of plastic ocean debris affecting — and in many cases, killing — aquatic life. We cover this in detail in our entry on Plastic Pollution, found here.
Does plastic affect human health?
There is currently no evidence of negative health impacts of plastic exposure to humans. However, research is ongoing. We cover this in detail in our entry on Plastic Pollution, found here.
Are plastic straws a big deal?
With a rising interest in action against plastic pollution, plastic straws have received a lot of attention. They've been a focus in the media as corporations, restaurant chains and cafe outlets have pledged to ban or phase them out completely.
But are straws a big deal? Not really. It's estimated that if all straws around the world's coastlines were lost to the ocean, this would account for approximately 0.03 percent of ocean plastics. A global ban on their use could therefore achieve a maximum of a 0.03 percent reduction. Why have straws in particular received so much attention? Probably because: (a) for most people (not all — some people struggle to drink without one), straws are unnecessary; and (b) it's a quick and low-risk step for businesses to be seen to be taking active steps in addressing this issue.
Reducing plastic straw use is — for the most part — not a bad thing to do. It can reduce plastic use a little. If this is a first step towards large-scale commitments to tackling plastic consumption, then it's a useful contribution. But as the late David MacKay noted: “If we all do a little, we’ll only achieve a little”. We must do a lot; we must tackle the high-impact options that will make a difference at the global level.
As some have highlighted: other sources of plastic pollution — such as discards of fishing nets and lines (which contributed to more than half of plastics in the Great Pacific Garbage Patch) receive significantly less attention. With effective waste management systems across the world, mismanaged plastics at risk of entering the ocean could decline by more than 80 percent. If we focus all of our energy on contributions of negligible size, we risk diverting our focus away from the large-scale contributions we need.
What can I do if I want to stop plastic pollution of the oceans?
If we want to reduce or stop the amount of plastic entering the oceans, what can we do?
There are multiple levels at which we can answer this question: there are things we can do as individuals, innovators, corporations, and in policy-making and financing.
Individuals:
- Cut out non-essential plastics where possible. As described in an earlier question, plastic can play a crucial role in many aspects: it is essential to preserving food quality, safety and shelf-life thereby preventing food wastage, for example. We must therefore be careful in cutting out plastics completely (this could lead to negative environmental consequences elsewhere). But if there are areas where you can reduce plastic usage which knock-on negative impacts, this is a good place to start.
- If you can replace single-use plastics with long-term, sustainable alternatives then substitute. To make this worthwhile across other environmental metrics (e.g. energy use, water use, greenhouse gas emissions), you often need to use them many times over a significant period of time. If you continually purchase alternatives to single-use plastic bags, for example, you’re probably increasing your environmental impact in other ways.
- In most cases, recycling plastic is better than incineration or landfill. Therefore recycle whenever possible. However, it’s important to note that recycling is not a holy grail to the plastic challenge. Most plastics are recycled only once or a few timesbefore also ending up in landfill or incineration. The notion that recycled plastic has no impact (and can therefore be used indefinitely) is a misconception.
- Look at your local recycling guidelines to make sure you know what can and can’t be recycled in your area. Avoid putting plastics in recycling which cannot be handled properly. If in doubt, you’re better to put it in landfill than risk contaminating the whole recycling load (if recycling loads have significant levels of contamination they be judged to be non-economic to sort and therefore sent straight to landfill).
- In high-income countries (typically with good waste management systems), plastics at risk of entering the ocean arise from littering and dumping of waste by the public. It really shouldn't have to be said: don't litter or abandon your waste, and call out anyone who does. Through collective action, zero tolerance can become a societal norm.
- As individuals we can be limited in the magnitude of our impact. The above changes can make a contribution, but as the late David MacKay noted: “If we all do a little, we’ll only achieve a little”. As we quantified in our main Plastic Pollution entry, even if all countries across Europe and North America cut out plastic use completely, global mismanaged plastic would decline by less than five percent. To drive urgent and large-scale change, arguably our most important role lies in putting pressure on governments and policy-makers to collaborate globally (see below).
Governments and policy-makers:
- It has been a historic trend that some high-income countries have exported some of their recyclable plastics elsewhere. This has often been to mid- and low-income countries where poor waste management infrastructure has led to high levels of mismanaged waste (see the statistics and discussion on this in our Plastic Pollution entry). This exported waste is therefore at risk of entering the ocean. High-income countries should manage all of their waste appropriately and avoid such transfers to countries which higher risk of poor management.
- Some have proposed that if trade of recycled plastics was maintained, mid- or low-income countries should tax the plastics they accept.40 These taxes should be used to expand and improve waste management infrastructure.
- An estimated 20 percent of ocean plastic pollution results from the fishing industry. However, in particular regions — for example, the Great Pacific Garbage Patch — fishing activity is estimated to generate more than half of plastic pollution. Implementing and monitoring of strict regulations on the prevention of waste from fishing activity is important not only at national levels but through regional and global cooperation.
- The majority of plastic enters the ocean as a result of inadequate waste management; open landfills and dumps can’t effectively prevent plastics from being lost to the environment. Improving waste management infrastructure – particularly across industrializing countries – is critical and urgent if we are to prevent and reduce plastics entering the ocean. As a general sense of magnitude: if all countries had the management infrastructure of high-income countries (i.e. no mismanaged waste with the exception of littering), global plastics at risk of entering the ocean could decline by more than 80 percent.
Global cooperation to upscale waste management is therefore crucial. Such solutions are not new or innovative: they have already been implemented successfully across many countries. Note that this is not a case of finger-pointing or blame: rich countries too have benefited from the rapid industrialization (a rate at which waste management could not keep up) of others. This is a global system we have collective responsibility for.
Middle- and low-income countries where plastics are poorly managed have an obvious role and responsibility. But if high-income countries are truly serious about addressing the ocean plastic issue, the most impactful way to contribute is to invest in the improvement of waste management infrastructure practices across the world. Without such investment and cooperation we will not be able to reduce the quantity of plastic entering the ocean. We are still currently on a trend of rapidly increasing plastic waste: to stabilise, let alone reduce, will require large-impact solutions.
Innovation and industry:
Effective management of waste we produce is an essential and urgent demand if we are to prevent plastic entering the ocean. As noted above, this is a solution we know how to achieve: many countries have low levels of mismanaged waste. This is important, regardless of how successful we are in reducing plastic usage.
However, reducing demand for new plastic production is also crucially important. Whilst recycled plastic is usually favourable to primary plastics, it is not a long-term solution: most recycled plastics still end up in landfill or incineration after one or two cycles.41 For recycling to be sustainable over the long-term, innovations which would allow for continuous recycling would have to be developed. As noted in another question, there has been promising progress in recent years in the development of polymer materials which can be chemically recycled back to their initial raw materials.42However, they are currently expensive and unfavourable in terms of energy inputs.43
The economic viability and environmental trade-offs will be critical components to the development of not only recyclable materials but other alternatives. Plastic is so widely used because it is cheap, versatile, and requires relatively little energy, water and land to produce. To achieve wide uptake of alternatives across countries of all income levels, breakthrough alternatives will have to be economically competitive with current methods. Functionality, price and scalability of innovations are key to addressing this challenge.
Can we remove plastic already in the ocean?
Plastic removal at large-scale is always going to be a major challenge. This becomes an even greater challenge over time, since plastics in the ocean tend to break down into smaller particles (and the smaller they are, they less easy it is to detect and then remove them at scale). Of course the easiest way to mitigate this problem is to stop plastic entering the ocean in the first place.
But still, we already have a large quantity of plastic in the ocean and this will continue (even if we can begin to reduce the amount that reaches the ocean in the years which follow).
Very small particles (microplastics, for example) are difficult to remove. Technologies being proposed currently for plastic removal therefore tend to focus on larger plastics. The fact that plastic tends to accumulate in gyres at the centre of ocean basins makes this easier: it concentrates plastics for removal.
The removal solution which has received the most attention from investors and researchers is The Ocean Cleanup. They are focusing on one major gyre of plastic: the Great Pacific Garbage Patch. Their technology in simple terms deploys buoyant tubes several kilometres in length. The project claim it can capture plastic ranging in size from tens of metres down to 1 cm.
It's too early to say whether this could be a feasible contribution. You can follow their milestone journey here. They make some bold claims, stating that full deployment of the technology could remove 50% of the plastic within 5 years. The prototype has been proven at various small-scales and in the summer of 2018 launch their first cleanup system in the Great Pacific Garbage Patch. If all goes well, their timeline suggests they aim to expand globally in 2020.
Is it true that some types of worm can break down plastic?
Yes, in 2017 researchers discovered that the wax worm (the larvae of the wax moth) has the ability to break down polyethylene (PE).44 PE accounts for around 40% of global plastics.
PE is largely non-degradable, but there have been a couple of previous instances where particular bacteria or fungi have been able to break it down at very, very slow rates. This latest discovery of the wax worm, however, showed faster rates of breakdown — although still slow. The researchers left 100 wax worms on a PE plastic bag for 12 hours and measured a 92 milligram breakdown of the plastic (about 3% of the plastic bag).
These rates are of course very slow, and at a tiny scale. The plan wouldn't be to scale-up the use of wax worms for plastic degradation — this would be unscalable. However, this discovery could be useful in allowing us to identify a particular enzyme which breaks down plastics. The authors suggest that wax worms break down the carbon-carbon bonds in PE either from the organism itself, or from the generation of a particular enzyme from its flora.
It could be possible to produce this enzyme or the bacteria which secrete this given enzyme at industrial scales.
Are there types of bacteria that can break down plastic?
Yes, there are particular strains of bacteria that are effective in breaking down plastic.
The most prominent discovery of this bacteria was made in Japan where researchers found a bacterium, Ideonella sakaiensis 201-F6, which could digest polyethylene terephthalate (PET) — the material used for single-use plastic bottles.45 This bacterium does so by producing and secreting an enzyme called PETase.
PETase (a protein which accelerates reactions) can split certain chemical bonds in PET; the bacteria can then absorb the smaller molecules it left behind (which contain carbon, and can be used by the bacteria as fuel/food).46
This breakthrough has been shown at very small laboratory scales. However, the authors and researchers in this field are open about the fact that this is not a near-term solution and would take major technological and scientific developments before it can close to the scale that would have an impact.
Footnotes
-
This is assuming a mass of 75 kg per person [(381,000,000*1,000kg)/75kg per person=5,080,000,000 people]
-
Neufeld, L., Stassen, F., Sheppard, R., & Gilman, T. (2016). The new plastics economy: rethinking the future of plastics. In World Economic Forum. Available at: http://www3.weforum.org/docs/WEF_The_New_Plastics_Economy.pdf.
-
Jambeck, J. R., Geyer, R., Wilcox, C., Siegler, T. R., Perryman, M., Andrady, A., ... & Law, K. L. (2015). Plastic waste inputs from land into the ocean. Science, 347(6223), 768-771. Available at: http://science.sciencemag.org/content/347/6223/768.
-
Li, W. C., Tse, H. F., & Fok, L. (2016). Plastic waste in the marine environment: A review of sources, occurrence and effects. Science of the Total Environment, 566, 333-349. Available at: https://www.sciencedirect.com/science/article/pii/S0048969716310154.
-
Lebreton, L., Slat, B., Ferrari, F., Sainte-Rose, B., Aitken, J., Marthouse, R., ... & Noble, K. (2018). Evidence that the Great Pacific Garbage Patch is rapidly accumulating plastic. Scientific Reports, 8(1), 4666. Available at: https://www.nature.com/articles/s41598-018-22939-w.
-
Asakura, H., Matsuto, T., & Tanaka, N. (2004). Behavior of endocrine-disrupting chemicals in leachate from MSW landfill sites in Japan. Waste Management, 24(6), 613-622. Available at: https://www.sciencedirect.com/science/article/pii/S0956053X04000261.
-
European Commission (2000). The Behaviour of PVC in Landfills. Available at: http://ec.europa.eu/environment/waste/studies/pvc/landfill.pdf.
-
Eriksson, O., & Finnveden, G. (2009). Plastic waste as a fuel-CO2-neutral or not?. Energy & Environmental Science, 2(9), 907-914. Available at: http://pubs.rsc.org/en/content/articlelanding/2009/ee/b908135f.
-
Verma, R., Vinoda, K. S., Papireddy, M., & Gowda, A. N. S. (2016). Toxic Pollutants from Plastic Waste-A Review. Procedia Environmental Sciences, 35, 701-708. Available at: https://www.sciencedirect.com/science/article/pii/S187802961630158X.
-
Barabad, M. L. M., Jung, W., Versoza, M. E., Lee, Y. I., Choi, K., & Park, D. (2018). Characteristics of Particulate Matter and Volatile Organic Compound Emissions from the Combustion of Waste Vinyl. International journal of environmental research and public health, 15(7).
-
Mukherjee, A., Debnath, B., & Ghosh, S. K. (2016). A review on technologies of removal of dioxins and furans from incinerator flue gas. Procedia Environmental Sciences, 35, 528-540. Available at: https://www.sciencedirect.com/science/article/pii/S1878029616301268.
-
De Meester, M., Kiss, P., & Braeckman, L. (2018). 317 Occupational dioxin exposure of workers in municipal waste incinerators. Available at: http://oem.bmj.com/content/75/Suppl_2/A401.3?utm_source=trendmd&utm_medium=cpc&utm_campaign=oem&utm_content=consumer&utm_term=0-A.
-
Nagpure, A. S., Ramaswami, A., & Russell, A. (2015). Characterizing the spatial and temporal patterns of open burning of municipal solid waste (MSW) in Indian cities. Environmental Science & Technology, 49(21), 12904-12912. Available at: https://pubs.acs.org/doi/abs/10.1021/acs.est.5b03243
-
Shih, Y. H., Kasaon, S. J. E., Tseng, C. H., Wang, H. C., Chen, L. L., & Chang, Y. M. (2016). Health risks and economic costs of exposure to PCDD/Fs from open burning: a case study in Nairobi, Kenya. Air Quality, Atmosphere & Health, 9(2), 201-211. Available at: https://link.springer.com/article/10.1007/s11869-015-0325-8
-
Phoungthong, K. (2017). Municipal solid waste management in Thailand. Current Science, 112(4), 674. Available at: https://www.researchgate.net/profile/Khamphe_Phoungthong/publication/315487357_Municipal_solid_waste_management_in_Thailand/links/58d603d8aca2727e5ebe296e/Municipal-solid-waste-management-in-Thailand.pdf
-
Of course, the most useful options of reducing consumption or reusing still apply. Here we are talking about the remaining plastic which ends up as waste.
-
Bernardo, C. A., Simões, C. L., & Pinto, L. M. C. (2016, October). Environmental and economic life cycle analysis of plastic waste management options. A review. In AIP Conference Proceedings (Vol. 1779, No. 1, p. 140001). AIP Publishing. Available at: https://aip.scitation.org/doi/pdf/10.1063/1.4965581.
-
Geyer, R., Kuczenski, B., Zink, T., & Henderson, A. (2016). Common misconceptions about recycling. Journal of Industrial Ecology, 20(5), 1010-1017. Available at: https://onlinelibrary.wiley.com/doi/full/10.1111/jiec.12355.
-
Eriksson, O., & Finnveden, G. (2009). Plastic waste as a fuel-CO2-neutral or not?. Energy & Environmental Science, 2(9), 907-914. Available at: http://pubs.rsc.org/en/content/articlelanding/2009/ee/b908135f.
-
DEFRA (2017). Statistics on waste managed by local authorities in England in 2016/17. UK Department for Environment, Food and Rural Affairs. Available at: https://assets.publishing.service.gov.uk/government/uploads/system/uploads/attachment_data/file/664594/LACW_mgt_annual_Stats_Notice_Dec_2017.pdf.
-
Brooks, A. L., Wang, S., & Jambeck, J. R. (2018). The Chinese import ban and its impact on global plastic waste trade. Science Advances, 4(6), eaat0131. Available at: http://advances.sciencemag.org/content/4/6/eaat0131.
-
Lakhan, C. (2015). A comparison of single and multi-stream recycling systems in Ontario, Canada. Resources, 4(2), 384-397. Available at: http://www.mdpi.com/2079-9276/4/2/384/htm.
-
Geyer, R., Jambeck, J. R., & Law, K. L. (2017). Production, use, and fate of all plastics ever made. Science Advances, 3(7), e1700782. Available at: http://advances.sciencemag.org/content/3/7/e1700782.
-
Neufeld, L., Stassen, F., Sheppard, R., & Gilman, T. (2016). The new plastics economy: rethinking the future of plastics. In World Economic Forum. Available at: http://www3.weforum.org/docs/WEF_The_New_Plastics_Economy.pdf.
-
Sardon, H., & Dove, A. P. (2018). Plastics recycling with a difference. Science, 360(6387), 380-381. Available at: http://science.sciencemag.org/content/360/6387/380.
-
Zhu, J. B., Watson, E. M., Tang, J., & Chen, E. Y. X. (2018). A synthetic polymer system with repeatable chemical recyclability. Science, 360(6387), 398-403. Available at: http://science.sciencemag.org/content/360/6387/398.
-
U.S. National Park Service; Mote Marine Lab, Sarasota, FL; National Oceanic and Atmospheric Administration Marine Debris Program. Available at: https://www.des.nh.gov/organization/divisions/water/wmb/coastal/trash/documents/marine_debris.pdf.
-
Geyer, R., Jambeck, J. R., & Law, K. L. (2017). Production, use, and fate of all plastics ever made. Science Advances, 3(7), e1700782. Available at: http://advances.sciencemag.org/content/3/7/e1700782.
-
European Bioplastics, Bioplastics—Facts and Figures (European Bioplastics, 2017). Available at: http://docs.european-bioplastics.org/publications/EUBP_Facts_and_figures.pdf.
-
UNEP (2015) Biodegradable Plastics and Marine Litter. Misconceptions, concerns and impacts on marine environments. United Nations Environment Programme (UNEP). Available at: https://europa.eu/capacity4dev/unep/document/biodegradable-plastics-and-marine-litter-misconceptions-concerns-and-impacts-marine-environ.
-
Marsh, K., & Bugusu, B. (2007). Food packaging—roles, materials, and environmental issues. Journal of Food Science, 72(3), R39-R55. Available at: https://onlinelibrary.wiley.com/doi/abs/10.1111/j.1750-3841.2007.00301.x.
-
Opara, U. L. (2013). A review on the role of packaging in securing food system: Adding value to food products and reducing losses and waste. African Journal of Agricultural Research, 8(22), 2621-2630. Available at: http://www.academicjournals.org/journal/AJAR/article-full-text-pdf/80C982E34864.
-
UN FAO (2011). Appropriate food packaging solutions for developing countries. Food and Agriculture Organization of the United Nations. Available at: http://www.fao.org/3/a-i3684e.pdf.
-
Licciardello, F. (2017). Packaging, blessing in disguise. Review on its diverse contribution to food sustainability. Trends in Food Science & Technology, 65, 32-39. Available at: https://www.sciencedirect.com/science/article/pii/S092422441730 1644.
-
Silvenius, F., Grönman, K., Katajajuuri, J. M., Soukka, R., Koivupuro, H. K., & Virtanen, Y. (2014). The role of household food waste in comparing environmental impacts of packaging alternatives. Packaging Technology and Science, 27(4), 277-292. Available at: https://onlinelibrary.wiley.com/doi/abs/10.1002/pts.2032.
-
Williams, H., & Wikström, F. (2011). Environmental impact of packaging and food losses in a life cycle perspective: a comparative analysis of five food items. Journal of Cleaner Production, 19(1), 43-48. Available at: https://www.sciencedirect.com/science/article/pii/S0959652610003239.
-
In her TED Talk, Leyla Acaroglu, shows that in the comparison of paper versus plastic bags, paper bags tend to have a higher environmental footprint in terms of greenhouse gas emissions. To function as a bag, substantially more paper is needed than plastic (i.e. a paper bag is at least 2.5 times heavier than a plastic bag).
-
Bisinella, V., Albizzati, P. F., Astrup, T. F., & Damgaard, A. (2018). Life Cycle Assessment of grocery carrier bags. Available at: https://www2.mst.dk/Udgiv/publications/2018/02/978-87-93614-73-4.pdf.
-
Eriksen, M., Lebreton, L. C., Carson, H. S., Thiel, M., Moore, C. J., Borerro, J. C., ... & Reisser, J. (2014). Plastic pollution in the world's oceans: more than 5 trillion plastic pieces weighing over 250,000 tons afloat at sea. PloS one, 9(12), e111913. Available at: http://journals.plos.org/plosone/article?id=10.1371/journal.pone.0111913.
-
Brooks, A. L., Wang, S., & Jambeck, J. R. (2018). The Chinese import ban and its impact on global plastic waste trade. Science Advances, 4(6), eaat0131. Available at: http://advances.sciencemag.org/content/4/6/eaat0131.
-
Geyer, R., Jambeck, J. R., & Law, K. L. (2017). Production, use, and fate of all plastics ever made. Science Advances, 3(7), e1700782. Available at: http://advances.sciencemag.org/content/3/7/e1700782.
-
Sardon, H., & Dove, A. P. (2018). Plastics recycling with a difference. Science, 360(6387), 380-381. Available at: http://science.sciencemag.org/content/360/6387/380.
-
Zhu, J. B., Watson, E. M., Tang, J., & Chen, E. Y. X. (2018). A synthetic polymer system with repeatable chemical recyclability. Science, 360(6387), 398-403. Available at: http://science.sciencemag.org/content/360/6387/398.
-
Bombelli, P., Howe, C. J., & Bertocchini, F. (2017). Polyethylene bio-degradation by caterpillars of the wax moth Galleria mellonella. Current Biology, 27(8), R292-R293. Available at: https://www.sciencedirect.com/science/article/pii/S0960982217302312.
-
Yoshida, S., Hiraga, K., Takehana, T., Taniguchi, I., Yamaji, H., Maeda, Y., ... & Oda, K. (2016). A bacterium that degrades and assimilates poly (ethylene terephthalate). Science, 351(6278), 1196-1199. Available at: http://science.sciencemag.org/content/351/6278/1196.full.
-
Austin, H. P., Allen, M. D., Donohoe, B. S., Rorrer, N. A., Kearns, F. L., Silveira, R. L., ... & Mykhaylyk, V. (2018). Characterization and engineering of a plastic-degrading aromatic polyesterase. Proceedings of the National Academy of Sciences, 115(19), E4350-E4357. Available at: http://www.pnas.org/content/early/2018/04/16/1718804115.
Our World in Data is free and accessible for everyone. Help us do this work by making a donation.Donate now


License: All of Our World in Data is completely open access and all work is licensed under the Creative Commons BY license. You have the permission to use, distribute, and reproduce in any medium, provided the source and authors are credited.