The new way of modeling the Earth's climate-November 2021
Bogdan Góralski
Library of the History Faculty of the University of Warsaw.
Abstract
We have been observing synchronous changes in atmospheric pressure at certain points of the globe for a long time, but so far no one has guessed the causes of pressure changes. In this paper, he defines the causes that lead to short- and long-term changes in atmospheric pressure in Reykjavik, Iceland, and Ponta Delgada, in the Azores. Both points now lie close to the boundaries of the high and low atmospheric pressure zones. The repeatable movements a of the Earth's coating under the stationary atmosphere caused by the variable gravitational interaction of the Solar System's objects causes points on the moving surface of the globe to shift between the zones of high and low atmospheric pressure. The synchronous differences in atmospheric pressure between Reykjavik in the north and Ponta Delgada in the south, which have been observed for many years, can only be explained by the movements of the Earth's coating in the north-south direction. The short-term movement of the Earth's surface several degrees latitude under the static atmospheric pressure zones causes synchronous pressure changes at sea level SLP in Reykjavik and Ponta Delgada in the Azores. When the Earth's coating moves 30-40 degrees latitude every 100,000 years, there are glacial periods in the regions of the globe close to the geographic pole. We observe large displacements of the Earth's coating in the apparent movements of magnetic poles recorded by palaeomagnetic records in volcanic and sedimentary rocks from a given geological period. Until now, the phenomenon of apparent displacement of magnetic poles until their position is reversed, the so-called magnetic reversal. Magnetic reversal was a mystery, but in my theory, it is easy to explain. Sometimes the Earth's coating rotates 180 degrees from the ecliptic and then there is an apparent magnetic pole reversal phenomenon recorded on the Earth's surface in palaeomagnetic recordings. The movements of the Earth's coating, (the northern hemisphere are denser and heavier than the southern hemisphere), cause changes in the moment of inertia of the spinning globe, resulting in changes in the Earth's rotation speed (and climatic changes on Earth) recorded today as LOD-length of Day. LOD changes are synchronous with changes in atmospheric pressure in Reykjavik and Ponta Delgada because they are caused by one cause - changes in the position of the Earth's coating. When LOD (length of day) decreases-rate of rotation of the Earth increases, and SLP (sea level pressure) in Reykjavik grows, and in Ponta Delgada SLP drops and vice versa. It means that Earth’s coating moves to the north when SLP in Reykjavik grows (in that time SLP in Ponta Delgada drops) and when SLP in Reykjavik drops (in Ponta Delgada grows that time) it means Earth’s coating moves to the south. I described the mechanism of changes in the Earth's climate linked to the movements of the Earth's coating in a book (published on the Internet on Google Books) entitled The new look at the Earth's climate mechanism: The Solar System shapes the Earth's climate change-link:
https://play.google.com/store/books/details?id=eZu-DwAAQBAJ
The excerpt below is a part of interesting work on ITCZ shifts entitled Tropical rainfall over the last two millennia: evidence for a lowlatitude hydrologic seesaw FranziskaA. Lechleitner1,2, Sebastian F. M. Breitenbach3, Kira Rehfeld4, Harriet E. Ridley2, YemaneAsmerom5, Keith M. Prufer6, Norbert Marwan7, BedarthaGoswami7,8, Douglas J. Kennett9, ValorieV.Aquino6, Victor Polyak5, Gerald H. Haug1,10, Timothy I. Eglinton1 & James U. L. Baldin.
"Here we investigate, based on climate proxy reconstructions from both hemispheres, the inter-hemispherical phasing of the Intertropical Convergence Zone (ITCZ) and the low- to mid-latitude teleconnections in the Northern Hemisphere over the past 2000 years. A clear feature is a persistent southward shift of the ITCZ during the Little Ice Age until the beginning of the 19th Century. Strong covariation between our new composite ITCZ-stack and North Atlantic Oscillation (NAO) records reveals a tight coupling between these two synoptic weather and climate phenomena over decadal-to-centennial timescales.
This relationship becomes most apparent when comparing two precisely dated, high-resolution paleorainfall records from Belize and Scotland, indicating that the low- to mid-latitude teleconnection was also active over annual-decadal timescales. It is likely a combination of external forcing, i.e., solar and volcanic, and internal feedbacks, that drives the synchronous ITCZ and NAO shifts via energy flux perturbations in the tropics".
"Monsoonal systems, like the ASM, the SASM, the Australian-Indonesian Summer Monsoon (AISM), the Indian Summer Monsoon (ISM), and the West African Monsoon (WAM) are affected by the hemispheric migration of the ITCZ as a major moisture flux conduit and by hemispheric temperature because land-sea temperature contrasts drive the monsoonal systems17,25".
In my opinion (see my works on GOOGLE BOOKS), shifts of the ITCZ Intertropical Convergence Zone and areas affected by precipitation and droughts are also caused by rapid movements of Earth's coating due to gravitational forces which come from Solar System. According to the cited above work during Little Ice Age the Intertropical Convergence Zone ITCZ shifted far to the South what means that Earth's coating shifted in that time in the opposite direction that means to the North. Also, the above excerpt: our new composite ITCZ-stack and North Atlantic Oscillation (NAO) records reveal a tight coupling between these two synoptic weather and climate phenomena over decadal-to-centennial timescales, proves the existence of synchronous coupling between shifts of Earth’s coating and position of the ITCZ and parameter NAO.
NAO and shift of Earth's coating
In the work entitled Tropical rainfall over the last two millennia: evidence for a low-latitude hydrologic seesaw, we see on Fig.4 comparison between NAO and ITCZ location during for example Maunder solar activity minimum. As ITCZ moved to the south NAO changed from positive to negative values. It means that the northern shift of Earth's coating caused movement of NAO from positive to negative values during the period of years 1700-1780 and during the period 1780-1840 coming back to positive values of NAO. According to NOAA-link: https://www.climate.gov/news-features/understanding-climate/climate-variability-north-atlantic-oscillation#:~:text=NAO%27s%20negative%20phase%20The%20NAO%20is%20in%20a,and%20the%20subtropical%20high%20are%20weaker%20than%20average. we know that:
The North Atlantic Oscillation Index describes changes in the strength of two recurring pressure patterns in the atmosphere over the North Atlantic: a low near Iceland, and a high near the Azores Islands.
Positive NAOI values indicate these features are strong, creating a big pressure difference between them. Strongly positive values are linked to warm conditions across the U.S. East and Northern Europe, and cold conditions across southern Europe.
Negative NAO indicates these features are relatively weak, and the pressure difference between them is smaller. Strongly negative values are linked to cold conditions in the U.S. East and Northern Europe, and warm conditions in Southern Europe.
Let's see what happened on the reconstruction of the apparent position of the North Magnetic Pole during Maunder Minimum according to St-Onge, Guillaume, and Joseph S. Stoner. "Paleomagnetism near the north magnetic pole: a unique vantage point for understanding the dynamics of the geomagnetic field and its secular variations." Oceanography 24.3 (2011): 42-50.
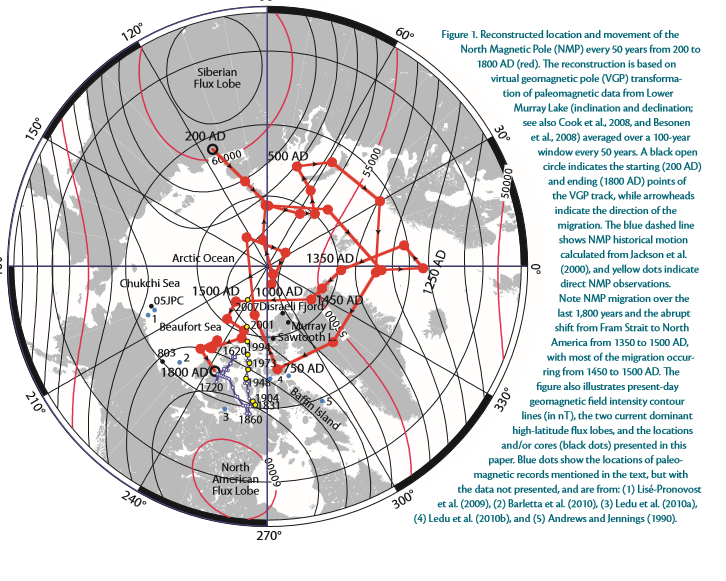
The apparent movement of the North Magnetic Pole around the geographic north pole
We see that North Magnetic Pole shifted from 1250 AD to 1860 AD from Siberia to North America what means that Earth's coating moved in the direction of WE to the East about 40 degrees latitude ie. about 4900km. The northern part of North America moved closer to the North geographic pole it means colder climatic conditions. Reykjavik and Ponta Delgada moved across pressure zones 4800 km to the East that is why NAO has changed from positive to negative values and came back to positive values during Maunder Minimum. During the XX-XX I century Earth's coating came back to the West for now.
Conclusion
Observation of changes in the position of Solar System objects and correlation of these changes with changes in LOD and weather will allow for the development of an accurate model of climate and weather changes around the globe. This work is a contribution to the development of a new model of forecasting climate change on Earth.
Jakuszowice, on November 1, 2021, 5:25 am Bogdan Jacek Góralski
Od dawna obserwujemy zmiany ciśnienia atmosferycznego w pewnych punktach globu ale do tej pory nikt nie odgadł przyczyn zmian ciśnienia. W niniejszej pracy definiuje te przyczyny, które doprowadzają do krótko i długo terminowych zmian ciśnienia atmosferycznego w Reykjaviku na Islandii oraz w Ponta Delgada na Azorach. Obydwa te punkty leżą obecnie na szerokości geograficznej bliskiej granic stref wysokiego i niskiego ciśnienia atmosferycznego. Nieustanne ruchy asymetrycznej w gęstości powłoki ziemskiej pod nieruchomą atmosferą powodowane przez zmienne oddziaływanie grawitacyjne obiektów Układu Słonecznego powodują przemieszczanie się punktów na ruchomej powierzchni globu ziemskiego pomiędzy strefami wysokiego i niskiego ciśnienia atmosferycznego. Obserwowane od wielu lat synchroniczne różnice ciśnienia atmosferycznego pomiędzy Reykjavikiem na północy a Ponta Delgada na południu mogą być wytłumaczone jedynie przez ruchy powłoki ziemskiej w kierunku północ –południe. Krótkookresowe ruchy powierzchni Ziemi o kilka stopni szerokości geograficznej pod nieruchomymi strefami ciśnienia atmosferycznego powodują synchroniczne zmiany ciśnienia na poziomie morza SLP w Reykjaviku i Ponta Delgada na Azorach. Kiedy powłoka ziemska co 100000 lat przemieszcza się o 30-40 stopni szerokości geograficznej występują okresy glacjalne w rejonach globu bliskich biegunowi geograficznemu. Duże przemieszczenia powłoki ziemskiej obserwujemy w pozornych ruchach biegunów magnetycznych rejestrowanych przez zapisy paleomagnetyczne w skałach wulkanicznych i osadowych z danego okresu geologicznego. Do tej pory zjawisko pozornego przemieszczania się biegunów magnetycznych, aż do odwrócenia ich położenia tzw. przebiegunowania magnetycznego było zagadką ale na gruncie mojej teorii jest proste do wytłumaczenia. Czasami powłoka ziemska obraca się o 180 stopni względem ekliptyki i występuje wtedy pozorne zjawisko odwrócenia biegunów magnetycznych rejestrowane na powierzchni Ziemi w zapisach paleomagnetycznych. Ruchy powłoki ziemskiej, (która w północnej hemisferze jest bardziej gęsta i cięższa (niż w południowej hemisferze) i częściej wychylana przez grawitację z położenia równowagi), powodują zmiany momentu bezwładności wirującej kuli ziemskiej skutkujące zmianami prędkości obrotu Ziemi (i zmianami klimatycznymi na Ziemi) rejestrowanymi współcześnie jako LOD-length of Day. Zmiany LOD są synchroniczne ze zmianami ciśnienia atmosferycznego w Reykjaviku i Ponta Delgada ponieważ są powodowane przez jedną przyczynę –zmiany położenia powłoki ziemskiej. Kiedy LOD (długość dnia) maleje, tempo rotacji Ziemi wzrasta i SLP (ciśnienie na poziomie morza) w Reykjaviku rośnie, aw Ponta Delgada SLP spada i na odwrót. Oznacza to, że powłoka Ziemi przesuwa się na północ, gdy rośnie SLP w Reykjaviku (w tym czasie spada SLP w Ponta Delgada), a gdy spada SLP w Reykjaviku (w tym czasie rośnie w Ponta Delgada), oznacza to, że powłoka Ziemi przesuwa się na południe. Mechanizm zmian klimatu ziemskiego sprzężonych z ruchami powłoki ziemskiej opisałem w książce (opublikowanej w Internecie na Google Books) zatytułowanej The new look at the Earth's climate mechanism: The Solar System shapes the Earth's climate change-link:
https://play.google.com/store/books/details?id=eZu-DwAAQBAJ
Obserwacje zmian położenia obiektów Układu Słonecznego i korelowanie tych zmian ze zmianami LOD i pogody pozwoli na opracowanie dokładnego modelu zmian klimatu i pogody na kuli ziemskiej. Niniejsza praca jest przyczynkiem do opracowania nowego modelu zmian klimatycznych na Ziemi.
Jakuszowice, dnia 1 listopada 2021 roku, godzina 5:25 Bogdan Jacek Góralski
Since 2010 I have conducted continuous observations of LOD and Poland's weather changes, and today I can say that LOD changes we can use for modeling weather and climate modeling. The IERS provides data on Earth orientation, on the International Celestial Reference System/Frame, on the International Terrestrial Reference System/Frame, and the half-year forecasts of LOD changes. Based on this forecast, we can model climate changes on Earth using my climate change model. I observed the negative correlation of atmospheric pressure at SLP sea level pressure (in Reykjavik, Iceland) and a positive correlation SLP in Ponta Delgada (Azores)with changes in LOD (length of day). This correlation confirms the existence of a close dependence of terrestrial climate changes on LOD changes and the changes of gravitational pulling of the Earth by solar system objects. These impacts and their results are explained in my book 'A modern look at the Earth's climate mechanism and the cosmo-geophysical system of the Earth' published in 2019 on the Internet (Google Books). The following work and drawings contained in it are probably proof of the truthfulness of my theory of the Earth's climate mechanism described in the above book.
Horizontal distribution of atmospheric pressure
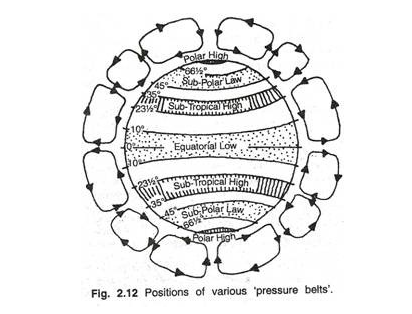
The changes in atmospheric pressure in Reykjavik may depend on the displacement of Reykjavik at latitude 64 ° 08′07 ″ N from the Sub-polar low atmospheric pressure zone to the Polar high pressure zone above the 66.5 degree latitude due to the movements of the Earth's coating under the atmosphere . At the same time, the movements of the Earth's shell cause changes in the speed of rotation of the earth, LOD, recorded by the IERS.
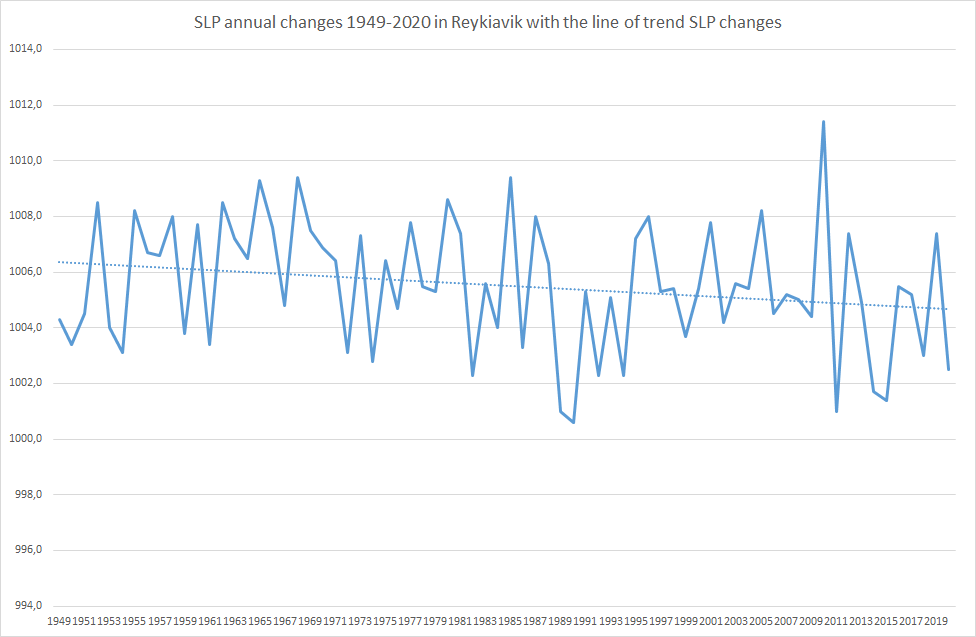
In the figure entitled "SLP annual changes 1949-2020 in Reykjavik" (above), we can see the dotted trend line for SLP changes in Reykjavik. The trend shows a steady decline in SLP, so it is likely that Reykiavik is moving south along with the Earth's coating to the Sub-Polar Low pressure zone.
Atmospheric pressure changes in Ponta Delgada in the Azores are due to the position of Ponta Delgada at a latitude of 37 ° 43′59 ″ N, so very close to the upper limit of the Sub-Tropical High pressure zone adjacent to the north to the low atmospheric pressure zone. The transition of Reykjavik to the zone of increased atmospheric pressure is accompanied by the transition of Ponta Delgad to the zone of reduced atmospheric pressure and vice versa.
Geographic coordinates of reykjavik, iceland
Latitude: 64 ° 08′07 ″ N
Longitude: 21 ° 53′43 ″ W.
Altitude: 37 m
Geographic coordinates of ponta delgada, portugal
Latitude: 37 ° 43′59 ″ N
Longitude: 25 ° 40′00 ″ W.
https://www.pmfias.com/pressure-belts-pressure-systems-equatorial-low-sub-tropical-high-sub-polar-low-polar-high/
Zmiany ciśnienia atmosferycznego w Reykjaviku mogą zależeć od przemieszczenia Reykjaviku leżącego na szerokości geograficznej 64°08′07″N ze strefy ciśnienia atmosferycznego Sub-polar low do strefy ciśnienia Polar high powyżej granicy 66,5 stopnia szerokości geograficznej co jest powodowane ruchami powłoki ziemskiej pod atmosferą. Ruchy powłoki ziemskiej powodują jednocześnie zmiany prędkości obrotu ziemi LOD rejestrowane przez IERS. Na rysunku zatytułowanym "SLP annual changes 1949-2020 in Reykjavik" (powyżej) widzimy kropkowaną linię trendu zmian SLP w Reykjaviku. Trend wskazuje na stałe obniżanie się SLP, a więc prawdopodobnie Reykiavik wraz z powłoką ziemską przesuwa się na południe do strefy ciśnienia Sub-Polar Low.
Zmiany ciśnienia atmosferycznego w Ponta Delgada na Azorach wynikają z położenia Ponta Delgada na szerokości geograficznej 37°43′59″N a więc bardzo blisko górnej granicy strefy ciśnienia Sub-Tropical High sąsiadującej od północy ze strefą obniżonego ciśnienia atmosferycznego. Przejściu Reykjaviku w strefę podwyższonego ciśnienia atmosferycznego towarzyszy przejście Ponta Delgada w strefę obniżonego ciśnienia atmosferycznego i odwrotnie.
The new way of modeling the Earth's climate
Bogdan Góralski
Library of the History Faculty of the University of Warsaw.
Introduction
We have been observing synchronous changes in atmospheric pressure at certain points of the globe for a long time, but so far no one has guessed the causes of pressure changes. In this paper, he defines the causes that lead to short- and long-term changes in atmospheric pressure in Reykjavik, Iceland, and Ponta Delgada, in the Azores. Both of these points now lie close to the boundaries of the high and low atmospheric pressure zones. The constant movements a of the Earth's shell under the stationary atmosphere caused by the variable gravitational interaction of the Solar System's objects cause points on the moving surface of the globe to shift between the zones of high and low atmospheric pressure. The synchronous differences in atmospheric pressure between Reykjavik in the north and Ponta Delgada in the south, which have been observed for many years, can only be explained by the movements of the Earth's shell in the north-south direction. The short-term movement of the Earth's surface several degrees latitude under the static atmospheric pressure zones causes synchronous pressure changes at sea level SLP in Reykjavik and Ponta Delgada in the Azores. When the Earth's crust moves 30-40 degrees latitude every 100,000 years, there are glacial periods in the regions of the globe close to the geographic pole. We observe large displacements of the Earth's shell in the apparent movements of magnetic poles recorded by palaeomagnetic records in volcanic and sedimentary rocks from a given geological period. Until now, the phenomenon of apparent displacement of magnetic poles until their position is reversed, the so-called magnetic reversal.Magnetic reversal was a mystery, but in my theory it is easy to explain. Sometimes the Earth's crust rotates 180 degrees from the ecliptic and then there is an apparent magnetic pole reversal phenomenon recorded on the Earth's surface in palaeomagnetic recordings. The movements of the Earth's shell, ( the northern hemisphere are denser and heavier than the southern hemisphere), cause changes in the moment of inertia of the spinning globe, resulting in changes in the Earth's rotation speed (and climatic changes on Earth) recorded today as LOD-length of Day. LOD changes are synchronous with changes in atmospheric pressure in Reykjavik and Ponta Delgada because they are caused by one cause - changes in the position of the Earth's shell. I described the mechanism of changes in the Earth's climate linked to the movements of the Earth's coating in a book published on the Internet on Google Books entitled The new look at the Earth's climate mechanism: The Solar System shapes the Earth's climate change-link:
https://play.google.com/store/books/details?id=eZu-DwAAQBAJ
Observation of changes in the position of Solar System objects and correlation of these changes with changes in LOD and weather will allow for the development of an accurate model of climate and weather changes around the globe. This work is a contribution to the development of a new model of climate change on Earth.
Jakuszowice, on November 1, 2021, 5:25 am Bogdan Jacek Góralski
Od dawna obserwujemy zmiany ciśnienia atmosferycznego w pewnych punktach globu ale do tej pory nikt nie odgadł przyczyn zmian ciśnienia. W niniejszej pracy definiuje te przyczyny, które doprowadzają do krótko i długo terminowych zmian ciśnienia atmosferycznego w Reykjaviku na Islandii oraz w Ponta Delgada na Azorach. Obydwa te punkty leżą obecnie na szerokości geograficznej bliskiej granic stref wysokiego i niskiego ciśnienia atmosferycznego. Nieustanne ruchy asymetrycznej w gęstości powłoki ziemskiej pod nieruchomą atmosferą powodowane przez zmienne oddziaływanie grawitacyjne obiektów Układu Słonecznego powodują przemieszczanie się punktów na ruchomej powierzchni globu ziemskiego pomiędzy strefami wysokiego i niskiego ciśnienia atmosferycznego. Obserwowane od wielu lat synchroniczne różnice ciśnienia atmosferycznego pomiędzy Reykjavikiem na północy a Ponta Delgada na południu mogą być wytłumaczone jedynie przez ruchy powłoki ziemskiej w kierunku północ –południe. Krótkookresowe ruchy powierzchni Ziemi o kilka stopni szerokości geograficznej pod nieruchomymi strefami ciśnienia atmosferycznego powodują synchroniczne zmiany ciśnienia na poziomie morza SLP w Reykjaviku i Ponta Delgada na Azorach. Kiedy powłoka ziemska co 100000 lat przemieszcza się o 30-40 stopni szerokości geograficznej występują okresy glacjalne w rejonach globu bliskich biegunowi geograficznemu. Duże przemieszczenia powłoki ziemskiej obserwujemy w pozornych ruchach biegunów magnetycznych rejestrowanych przez zapisy paleomagnetyczne w skałach wulkanicznych i osadowych z danego okresu geologicznego. Do tej pory zjawisko pozornego przemieszczania się biegunów magnetycznych aż do odwrócenia ich położenia tzw. przebiegunowania magnetycznego było zagadką ale na gruncie mojej teorii jest proste do wytłumaczenia. Czasami powłoka ziemska obraca się o 180 stopni względem ekliptyki i występuje wtedy pozorne zjawisko odwrócenia biegunów magnetycznych rejestrowane na powierzchni Ziemi w zapisach paleomagnetycznych. Ruchy powłoki ziemskiej, (która w północnej hemisferze jest bardziej gęsta i cięższa (niż w południowej hemisferze) i częściej wychylana przez grawitację z położenia równowagi), powodują zmiany momentu bezwładności wirującej kuli ziemskiej skutkujące zmianami prędkości obrotu Ziemi (i zmianami klimatycznymi na Ziemi) rejestrowanymi współcześnie jako LOD-length of Day. Zmiany LOD są synchroniczne ze zmianami ciśnienia atmosferycznego w Reykjaviku i Ponta Delgada ponieważ są powodowane przez jedną przyczynę –zmiany położenia powłoki ziemskiej. Mechanizm zmian klimatu ziemskiego sprzężonych z ruchami powłoki ziemskiej opisałem w książce opublikowanej w Internecie na Google Books zatytułowanej The new look at the Earth's climate mechanism: The Solar System shapes the Earth's climate change-link:
https://play.google.com/store/books/details?id=eZu-DwAAQBAJ
Obserwacje zmian położenia obiektów Układu Słonecznego i korelowanie tych zmian ze zmianami LOD i pogody pozwoli na opracowanie dokładnego modelu zmian klimatu i pogody na kuli ziemskiej. Niniejsza praca jest przyczynkiem do opracowania nowego modelu zmian klimatycznych na Ziemi.
Jakuszowice, dnia 1 listopada 2021 roku, godzina 5:25 Bogdan Jacek Góralski
Since 2010 I have conducted continuous observations of LOD and Poland's weather changes, and today I can say that LOD changes we can use for modeling weather and climate modeling. The IERS provides data on Earth orientation, on the International Celestial Reference System/Frame, on the International Terrestrial Reference System/Frame, and the half-year forecasts of LOD changes. Based on this forecast, we can model climate changes on Earth using my climate change model. I observed the negative correlation of atmospheric pressure at SLP sea level pressure (in Reykjavik, Iceland) and a positive correlation SLP in Ponta Delgada (Azores)with changes in LOD (length of day). This correlation confirms the existence of a close dependence of terrestrial climate changes on LOD changes and the changes of gravitational pulling of the Earth by solar system objects. These impacts and their results are explained in my book 'A modern look at the Earth's climate mechanism and the cosmo-geophysical system of the Earth' published in 2019 on the Internet (Google Books). The following work and drawings contained in it are probably proof of the truthfulness of my theory of the Earth's climate mechanism described in the above book.
Horizontal distribution of atmospheric pressure
The changes in atmospheric pressure in Reykjavik may depend on the displacement of Reykjavik at latitude 64 ° 08′07 ″ N from the Sub-polar low atmospheric pressure zone to the Polar high pressure zone above the 66.5 degree latitude due to the movements of the Earth's coating under the atmosphere . At the same time, the movements of the Earth's shell cause changes in the speed of rotation of the earth, LOD, recorded by the IERS.
Atmospheric pressure changes in Ponta Delgada in the Azores are due to the position of Ponta Delgada at a latitude of 37 ° 43′59 ″ N, so very close to the upper limit of the Sub-Tropical High pressure zone adjacent to the north to the low atmospheric pressure zone. The transition of Reykjavik to the zone of increased atmospheric pressure is accompanied by the transition of Ponta Delgad to the zone of reduced atmospheric pressure and vice versa.
Geographic coordinates of reykjavik, iceland
Latitude: 64 ° 08′07 ″ N
Longitude: 21 ° 53′43 ″ W.
Altitude: 37 m
Geographic coordinates of ponta delgada, portugal
Latitude: 37 ° 43′59 ″ N
Longitude: 25 ° 40′00 ″ W.
https://www.pmfias.com/pressure-belts-pressure-systems-equatorial-low-sub-tropical-high-sub-polar-low-polar-high/
Zmiany ciśnienia atmosferycznego w Reykjaviku mogą zależeć od przemieszczenia Reykjaviku leżącego na szerokości geograficznej 64°08′07″N ze strefy ciśnienia atmosferycznego Sub-polar low do strefy ciśnienia Polar high powyżej granicy 66,5 stopnia szerokości geograficznej co jest powodowane ruchami powłoki ziemskiej pod atmosferą. Ruchy powłoki ziemskiej powodują jednocześnie zmiany prędkości obrotu ziemi LOD rejestrowane przez IERS.
Zmiany ciśnienia atmosferycznego w Ponta Delgada na Azorach wynikają z położenia Ponta Delgada na szerokości geograficznej 37°43′59″N a więc bardzo blisko górnej granicy strefy ciśnienia Sub-Tropical High sąsiadującej od północy ze strefą obniżonego ciśnienia atmosferycznego. Przejściu Reykjaviku w strefę podwyższonego ciśnienia atmosferycznego towarzyszy przejście Ponta Delgada w strefę obniżonego ciśnienia atmosferycznego i odwrotnie.
Changes in LOD versus SLP changes in atmospheric pressure in Reykjavik in Iceland [hPa] during the period 1985-1988
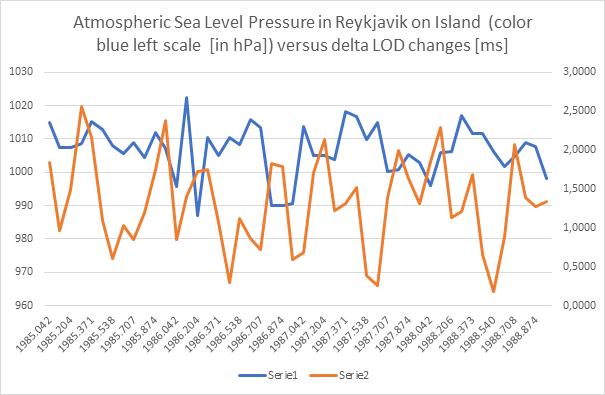
Fig. 1. Changes in LOD (color orange right scale in [ms]) versus SLP changes in atmospheric pressure in Reykjavik in Iceland [hPa] during the period 1985-1988
Source of SLP in Reykjavik: Icelandic Met Office link: https://en.vedur.is/climatology/data/
Source of delta LOD values: Earth Orientation Center IERS
Changes in LOD versus SLP changes in atmospheric pressure in Reykjavik in Iceland [hPa] during the period 2015-2018
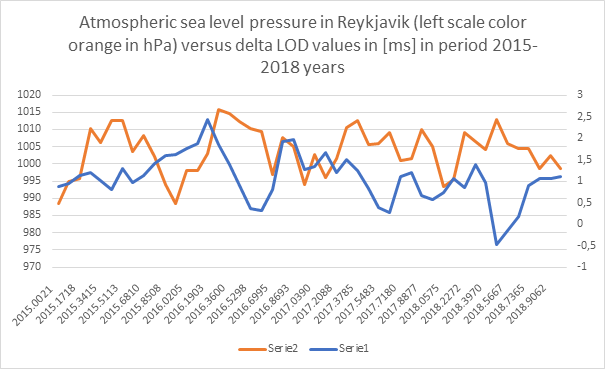
Fig.2 Changes in delta LOD (color orange right scale in [ms]) versus SLP changes in atmospheric pressure in Reykjavik in Iceland [hPa] during the period 2015-2018
Source of SLP in Reykjavik: Icelandic Met Office link: https://en.vedur.is/climatology/data/
Source of delta LOD values: Earth Orientation Center IERS
We see on Fif.1 and Fig.2 the negative correlation of both series of data SLP in Reykjavik and delta LOD.
Correlation of atmospheric pressure changes in Ponta Delgada in Azores and delta LOD (length of day) changes in periods 1985-1988
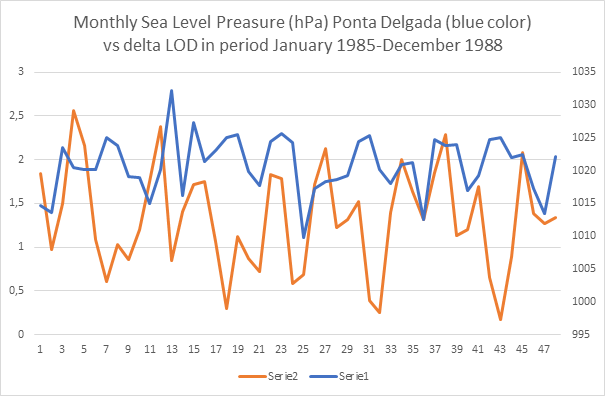
Fig.3 Changes in delta LOD (color orange right scale in [ms]) versus SLP changes in atmospheric pressure in Ponta Delgada in the Azores [hPa] during period 1985-1988
Source of data SLP in Ponta Delgada 1985-1988
https://psl.noaa.gov/gcos_wgsp/Timeseries/NAO_AZO/
Source of delta LOD values: Earth Orientation Center IERS
We see postive correlation of both sereies of data SLP in Ponta Delgada and delta LOD.
The LOD data (on the above plots) was subjected to Lagrange interpolation with an interpolation period of 31 days.
Comparison of SLP in Ponta Delgada and SLP in Reykjavik in period January 1985-December 1988.
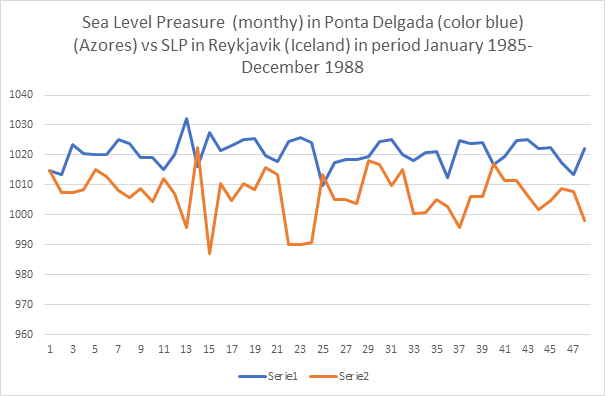
Fig. 4 Comparison of SLP in Ponta Delgada (blue one) and SLP [in hPa] in Reykjavik in period January 1985-December 1988.
We see the negative correlation of both series of data SLP in Ponta Delgada and Reykjavik.
Conclusions
In Fig.1, 2, we see a negative correlation between SLP and LOD, i.e., a decrease in the Earth's rotational speed (increase in delta LOD value) causes a reduction in atmospheric pressure in Reykjavik and vice versa.
In Fig.3, we see a positive correlation between SLP and delta LOD, i.e., a decrease in the Earth's rotational speed (increase in delta LOD value) causes an increase in atmospheric pressure in Ponta Delgada and vice versa.
In.Fig 4 we see the negative correlation of SLP in Reykjavik and Ponta Delgada.
My nineteen years of research on the Earth's climate mechanism can be used to the general forecast climate and weather changes in Europe and Poland. Further work on my climate theory will probably allow for accurate global climate and weather forecasts.
Warsaw, 23 March 2021, 5:20 Bogdan Góralski