

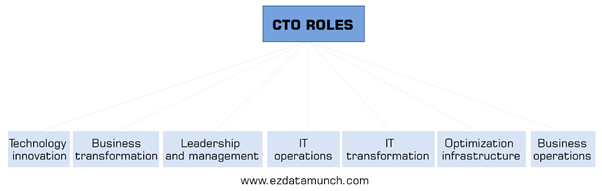
The CTO has special roles and responsibilities towards the company for any business development. The CTO officer plays a complex role in building a business and technology. CTO duties are related to the technical side of the business, depending on the scope of the business, marketing objectives, and operational areas. The CTO may have responsibilities such as C-level executives (CEO or CFO).
The position of CTO officer is attributed to a vague C-level role as there are many factors such as startup sector, business processing style, number of in-house and outsourced workers, and many more.
Typically, the CTO plays an important role in the following elements of the business:
To successfully handle the roles, responsibilities, and improvement of a technology company needed CTO dashboards and reports. This BI tool can consolidate multiple data points and support chief officers in strategic developments as well as online data analysis efforts, empowering their status of champions for new solutions.
What is a CTO Dashboard?
The CTO dashboard can be defined as a visual collection of IT KPIs and metrics related to your business and infrastructure. The CTO dashboard is an important tool for IT executives to evaluate, monitor, and analyze the process of all-important IT metrics.
The main goal of the CTO dashboard is to maintain and follow all IT-related tasks to keep the word running smoothly. The IT Dashboard alerts how your technology is performing, measure performance and identify problems and fix them as soon as possible.
Most CTO dashboards automatically collect, aggregate, analyze, and report data points from an organization's various technology assets, making it easy to gain insights from a wide range of data sources, and make better decisions.
What are CTO Reports
CTO reports are based on a collection of data and statistics that are present within the dashboard and provide a wealth of information based on established KPIs that can be easily automated and shared on the respective KPIs so that relevant IT performance monitoring can be done.
We can say that the CTO report is basically a static version of the CTO dashboard. While CTO dashboards show live data, CTO reports are periodic snapshots of the same information or more summarized data points.
What are the benefits of the CTO Dashboard?
Below are the key benefits of using the CTO dashboard for your business.
- Gives you complete business information about IT infrastructure
- Collects and report data from various data sources
- It simplifies your data and present visual representation
- Can know the alerts in emergencies
- Know your updated report of your technologies
- Share your reports between any team members and stakeholders
- Can able to access details anywhere, anytime, and on any device
CTO KPIs and metrics
Let’s discuss the key CTO KPIs and Metrics you must know for your CTO dashboards and reports.
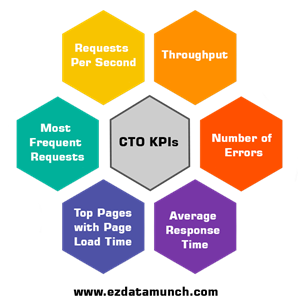
1. Requests Per Second
Requests per second can be defined as the number of requests generated per second by your server. It gives you detailed information about servers such as performance, server load, and concurrency.
2. Throughput
Throughput is defined as the amount of data received and sent per second by your website server. It helps you measure and optimize data costs.
3. Number of Errors
One of the most important factors to measure is the number of errors because you need to know what problems and difficulties people are facing while using your website or application. So, it is better to measure these errors in the total number of errors per day and break them down by error codes to detect and fix the most common errors.
4. Average Response Time
The term defines itself as the time taken by the server to complete a process request. Today everyone is trying to access everything faster, so the speed of your server should also be faster. If your server response time is longer, it means that your server is under heavy load. You should maintain server load and try to reduce server load for a better user experience.
5. Top Pages with Page Load Time
Page load time refers to the time it takes to load a webpage, website, or application. It is important to track the top 5 pages with the most page load times, as they will increase your average response time. Identify those pages and determine if you can reduce their page load time.
6. Most Frequent Requests
The most important aspect to measure is the frequent requests of users and serving them. It is important to measure because it will give a negative impact on user experience and loss of customer satisfaction.
Steps to Create CTO Dashboard
Below we have discussed the necessary steps to create a CTO dashboard.
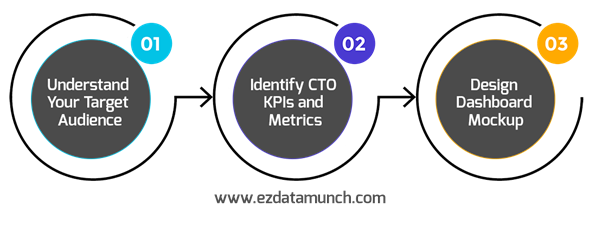
1. Understand Your Target Audience
The most important primary step is to understand your audience. You need to understand who is going to operate your dashboard, they can be CTOs, information technology managers, or a product manager. The position of CTO managers is always top of the roof so it is important to focus on the most important KPIs, metrics, and general audiences. The viewpoint for each role can be different such that the CTO only needs a holistic technology-related dashboard while the product manager only needs to view the product-related status. Therefore, it is better to organize a meeting about the goals of each profile, what they are in charge of, and whether the metrics matter to them.
2. Select CTO KPIs and Metrics
When setting your goal and target audience, the next important steps are to identify the necessary KPIs and metrics that measure performance against these goals. Coordinate with the CTO if something needs to be added to the dashboard.
3. Mockup Design Dashboard
Once you are set with the above two steps now use dashboard software to create your first mock-up design by using KPIs and Metrics you have filtered. While creating a mock-up you should remember that the most valuable metrics should be placed on top, trends & distributions in the middle and granular details at the bottom.
Make sure you choose the right visualization for each KPI metric to avoid confusing your audience. At last review your dashboard with stakeholders and decision-makers and start building your dashboard.
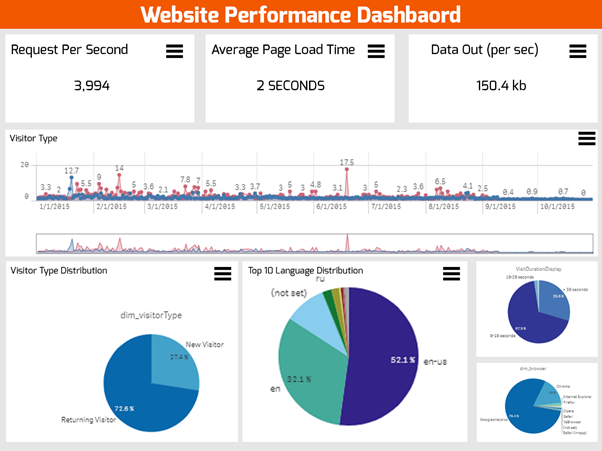
CTO Dashboard Examples
Below you can see the example of the CTO Dashboard.
Let's Conclude!
In this article, we have explained in detail the definition of a CTO dashboard and what measures have been taken to create a CTO dashboard. If you also want to check out your real-time CTO data dashboard with EzDataMunch, sign up for a free lifetime trial.