If your company is generating thousands of reports and millions of data by merchandising, trade, marketing, and financial activities. From that collect data that you select to run your direct and retail business? What key performance metrics and KPI’s are selecting, how your inventory is planning, how you manage your cash flow?
Corporate dashboards are worth exploring dashboards with all the major key factors under one roof. This allows us to visualize KPIs and depicts all key performance metrics from each department.
What is a Corporate Dashboard?
The corporate dashboard reflected the overall performance of the business by measuring key performance indicators in terms of customer service and satisfaction, sales analysis against the plan, and overall profitability. Corporate dashboards help you monitor your company and navigate uncertain business terrain.
To stay on top of your vision and strategy, this corporate dashboard will help you do so. By measuring and reporting your strategic plan, CEOs can develop an important framework that allows them to keep a pulse on the vitals of their company. If deviations from the overarching strategy are found, the CEO is alerted, giving them the opportunity to correct the course as necessary.
What are the benefits of Dynamic Corporate Dashboard?
Easy Dashboard and Simplify
Creating a corporate dashboard is simple and easy to understand. All you need to do is to select data sources to design an interactive dashboard chart. Data sources can be selected from SQL databases, CSV files, or any other social media data to be analyzed. It is better to analyze multiple charts on one dashboard than to analyze a single chart on a single dashboard. You can have a corporate dashboard with data from various data centers around the world.
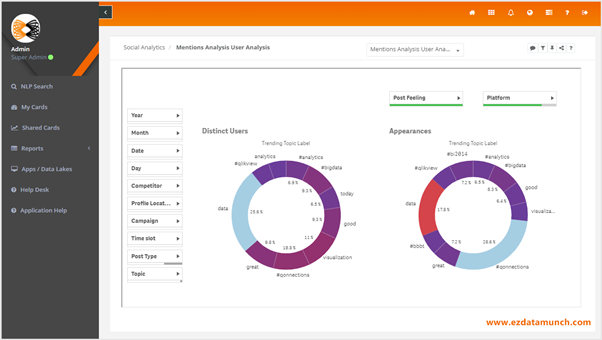
Realtime Visualization
The static dashboard was the traditional approach to view dashboards in spreadsheets. The major drawback of these dashboards is that the dashboard is difficult to understand and if there is no immediate manipulation of the data. Dynamic dashboards have therefore come into the picture where data can be analyzed in real-time. The dynamic corporate dashboard helps many business users to take necessary actions at any stage in the business.
Customization and sharing with any user
Modern dashboard makers allow users to customize the dashboard to their own style. We believe that a corporate dashboard should be used to process visual information for consumers and make decisions at a glance. The highly customizable dashboard with any theme and color appearance helps business users see and feel your brand personality
Easy-to-perform KPI drive performance
KPIs are the backbone of any business for decision-making. KPI not only helps businesses stand out but also drives team members to improve in measurable ways.
Let's look at examples of business dashboards for sales analytics dashboards. Sales representatives can view the overall sales dashboard and directly see how their performance is embedded in the bigger picture. The sales dashboard helps the sales team track and improve their performance. Daily and weekly sales reports can also serve as powerful feedback mechanisms to help managers test the sales department.
Access with any device
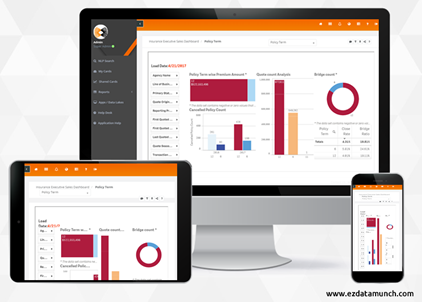
Today, mobile dashboards are playing an important role in everyone's life. This changes the way we interact with dashboards and plays an important role when it comes to business. It provides a quick glimpse of the state of the business on your mobile device which is of paramount importance for any business to make quick decisions for success.
However, all of your dashboards are browser-based, meaning that you can access them from your smartphone, tablet, netbook, laptop, or PC.
Below are some metrics and KPIs that we look at through indirect business dashboards
The KPI dashboard is a simple visual display of the most important information that decision-makers need to help them achieve objectives. The KPI dashboard is considered the best from an operational and strategic point of view. An operations dashboard allows you to examine the day-to-day processes and outputs of your business to ensure that everything is running smoothly.
- From e-commerce data, total sales generated; unique visitors; total new customers; inventory out of stock; sales per marketing effort (organic search, paid search, e-mail, shopping portals, banner ads, affiliate marketing, etc.).
- Finance may report sales actual to plan; summarized cash flow and days to refund/credit customers.
- Inventory Management indicators might show initial customer order fill rates compared to item fill rates for the year; summaries of cost recovery and margin loss by liquidation media; a summary of initial coverage of products.
- Customer Contact Centre indicators may be limited to call and order activity by channel; call to order ratio; summary of inquiries/complaints and service indicators such as time to answer and call abandonment rate.
Conclusion
In this period of uncertainty, there is no way for your direct businesses to achieve performance, customer service, sales and perform better than profitability.
EzDataMunch data visualization tool is flexible and reliable which saves user time for:
- Sorting columns in excels
- Switching between data sources and tools to create charts
- Easy involvement of non-technical staff
You can create your own corporate dashboard with your own business profile style by signing up for free lifetime access by EzDataMunch.