Failure Investigation of LiFePO4 Cells under Overcharge Conditions
Fan Xu1, Hao He1, YaDong Liu1, Clif Dun2, Yang Ren3, Qi Liu1, Mei-xian Wang1 and Jian Xie4,5,1
Published 20 March 2012 • ©2012 ECS - The Electrochemical Society
Abstract
The failure mechanism of LiFePO4 cells during overcharge conditions has been systematically studied using commercial A123 18650 cells at a 1C rate and different conditions – from 5% to 20% overcharge (SOC = 105% to 120%). SEM/EDX, high-energy synchrotron XRD (HESXRD), and cyclic voltammetry (CV) were used to characterize the morphology, structure, and electrode potentials of cell components both in situ and ex situ. The failure behaviors for A123 18650 cells experiencing different degrees of overcharges were found to be similar, and the 10% overcharge process was analyzed as the representative example. The Fe redox potentials in the 1.2 M LiPF6 EC/EMC electrolyte were measured during the overcharge/discharge process using CV, proving that Fe oxidation and reduction in the cell during the overcharge/discharge cycle is theoretically possible. A possible failure mechanism is proposed: during the overcharging process, metallic Fe oxidized first to Fe2+, then to Fe3+ cations; next, these Fe2+ and Fe3+ cations diffused to the anode side from the cathode side; and finally, these Fe3+ cations reduced first to Fe2+ cations, and then reduced further, back to metallic Fe. During overcharge/discharge cycling, Fe dendrites continued growing from both the anode and the cathode sides simultaneously, penetrating through the separator and forming an iron bridge between the anode and cathode. The iron bridge caused micro-shorting and eventually led to the failure of the cell. During the overcharge/discharge cycles, the continued cell temperature increase at the end of overcharge is evidence of the micro-shorting.
Li-ion batteries with lithium iron phosphate (LiFePO4) as a cathode have been widely used for both portable electronics (i.e. cellphones, laptops, etc.) and transportation (i.e. electric vehicles and hybrid electric vehicles). Lithium iron phosphate (LiFePO4) has many advantages such as good cycle life (80% of initial capacity after 1950 cycles for A 123 18650 cells), high safety performance due to the strong bonding between oxygen and phosphorus, and low cost due to its abundance on earth and its environmental benignity over other traditional Li-ion battery cathode materials1–5 (LiCoO2, LiNiO2 and LiMn2O4). Although the LiFePO4 cell is much safer than other Li-ion batteries, the safety of the LiFePO4 cell is still a critical issue for its applications in both portable electronics and transportation.6
In general, no matter how a Li-ion battery failure starts, the failure eventually evolves into a thermal runaway. The failures may be induced by external forces7 (i.e. severe mechanical or thermal damage), internal shorting6–8 (i.e. metal particles, poison), the poor thermal stability of Li-ion cells (i.e. material decomposition9,10), overcharging,9–11 the existence of a defective connection or failure of charging circuits, and over-discharging.12,13 Many sophisticated control devices have been developed, and materials preparation and process controls have been carefully managed to minimize the causes of failure. However, when a number of LiFePO4 cells are used in a battery pack, there is always a capacity distribution band because the capacity varies between different cells. This capacity band will broaden with the cycle number, and eventually, the capacity of a battery pack will be limited by the cell with the lowest capacity. Thus, the lowest capacity cell will experience overcharge and over-discharge, even if the whole pack is experiencing normal charge/discharge cycles. With a battery management system, the capacity band of a battery pack can be controlled within a range, but the band cannot be eliminated. Hence, understanding the behavior of LiFePO4 cells under overcharge and over-discharge conditions is critical for the safety of LiFePO4 cells. The work presented here is mainly focused on the behavior and failure mechanism of LiFePO4 cells under overcharge conditions; the behavior and failure mechanism under over-discharge conditions will be presented in a separate paper.
Many mechanisms have been proposed for being responsible for internal shorting during overcharge.6,8,11 Belov11 et al. suggested that one of the main factors of cell failure at overcharge might be microshorting initiated by a Li dendrite penetrating through the separator. It also has been noted that foreign metal particles (like iron) have a great effect on failure and have been considered a main cause for the failure of Li-ion cells during the overcharge process. Stringfellow et al.6 investigated the mechanism of the internal short circuit by implanting different metal particles into coin cells and 18650 cells. In coin cells, it was found that a metal dendrite formed in the anode side of the separator, implying that the metal particles grew back from anode to cathode. It was also found that, after implanting foreign metal particles, 18650 cells thermally ran away with a cell temperature exceeding 660°C, which could cause the thermal decomposition of cell components. Jin et al.'s results8 showed that the impurities containing iron elements in the raw material and the impurities that were formed during the charge–discharge cycles are the main causes of failure under overcharge conditions. These impurities were reduced on the graphite surface, and the iron dendrite formed gradually. This dendrite may penetrate through the separator, which results in the internal shorting of the cells.
However, little work has been done to systematically study the failure mechanism during the overcharge process, especially when using commercial A123 18650 LiFePO4 cells. It is important to know the exact potentials of the anode and cathode during the overcharge process, which can provide the theoretical foundation for whether the metal ion would be reduced or whether the metal will be oxidized in the overcharge process. It is also intriguing to know the source of the metal particles that result in the shorting in the overcharge process – whether the metal particles come from the raw material, from the decomposition of LiFePO4, or from the oxidation of the stainless steel case. In addition, it is still not clear whether there could be another cause leading to the failure of the A123 18650 LiFePO4 cell during overcharge, such as the structural transformation of the electrode materials (i.e. graphite and LiFePO4). To answer these questions, we concentrated our efforts on investigating the failure mechanism using A123 18650 LiFePO4 cells by studying the behavior of these cells and the electrode structural changes to elucidate the relationship between performance and microstructure changes of electrodes inside the A123 18650 LiFePO4 cells during the overcharge process. An in-situ high-energy synchrotron X-ray diffraction (HESXRD) technique and a three-electrode setup were employed to systematically study the failure mechanism of the A123 18650 LiFePO4 cell during the overcharge process.
Experimental
Overcharge LiFePO4 cell for failure.— Materials
All chemicals were used as received. The commercial cells chosen for this study were A123 18650 LiFePO4 cells (APR18650M 1A 3.3V 1100 mAh) from A123 Systems (Cambridge, MA), and LiPF6, EC, and EMC from Novolyte (Clevland, OH). Each cycling test was repeated on at least three different cells to ensure data reproducibility.
Electrochemical Apparatus
All potentials used in this paper were versus Li/Li+ electrode potential unless otherwise noted. Overcharge tests were carried out in an explosion-proof chamber using both the BT-5000 8-channel battery and the BT-2000 32-channel cycler with a temperature-control sensor (Arbin Instruments, TX). Galvanostat tests were performed on the A123 18650 LiFePO4 cells with a nominal 1100-mAh capacity. The cells were charged to 3.60 V at a 1C rate (constant current of 1.10 A) first, then the charging was continued at a constant voltage of 3.60 V until the current was < 0.02 A, which is regarded as a 100% state of charge (SOC). After a short rest (i.e. 5 min.), the cell was discharged at a 1C rate until the voltage reached 2.00 V, which is the discharge cutoff voltage of the cell (the corresponding capacity is 1100 mAh). This procedure is considered to be a 100% depth of discharge (DOD). The overcharge test was carried out using constant current charge at a 1C rate (i.e. 1.10 A) and the desired SOC was calculated using 1100 mAh as the 100% SOC baseline. Based on the Coulombs charged into the cell, the charge step was terminated when the cells reached 105% SOC (63 min., 1155 mAh), 110% SOC (66 min. 1210 mAh), 115% SOC (69 min., 1265 mAh), and 120% SOC (72 min., 1320 mAh). A thermocouple was placed on the skin of the A123 18650 LiFePO4 cell at the middle of the cell and the temperature was measured simultaneously with the voltage during the cycling test. The discharge-overcharge cycle was run until the cells failed. Current–voltage–temperature data were recorded every 5s during the overcharge-discharge cycle.
Measure potentials of each electrode during testing for the A123 18650 LiFePO4 cell
In the argon-filled glove box, the head and bottom of the case of a fresh A123 18650 LiFePO4 cell were carefully removed using a roller cutter. The roll of assembly of a 18650 LiFePO4 cell was placed into a container and immersed in the electrolyte. A lithium strip was inserted into this container as a reference electrode. The electrolyte was made with 1.2 M of LiPF6 in EC-EMC (3:7) and a 30 mL electrolyte was used to ensure complete immersion of the roll. The same normal cycle and 110% overcharge-discharge conditions mentioned in 2.1 were carried out in this experiment with the anode as the counter electrode, the cathode as the working electrode, and the Li metal as the reference electrode. The potentials of the anode and cathode and the voltage of the full cell were measured separately with three different channels of an 8-channel 1470E Multistat (Solartron, UK).
Half-cell cyclic voltammogram (CV) test
In order to further investigate the details of Fe/Fe3+ oxidization and reduction behavior in the overcharge-discharge cycles, three half-cell CV experiments were carried out.
Two types of working electrodes were used: 1) a pure iron electrode (CH Instruments, Inc., TX), and 2) a 99.99% Pt wire electrode (Fisher Scientific, NH). The Pt metal served as the counter electrode and the Li metal served as the reference electrode. Sandpaper and a 0.05 μm alumina suspension were employed to fully clean and remove the oxidation layer of the working electrodes. The potential window for cyclic voltammetry was set from −0.4 V to 5.0 V (according to the anode and cathode voltage obtained in the experiment described in 2.2) with a scan rate of 20 mV/s using a 1470E Multistat (Solartron Analytic, UK). Before CV measurement, a 200-cycle scan with a scan rate of 1 V/s between 0–5 V was used to clean the surface of the working electrodes.
A 1.2 M LiPF6/EC-EMC solution with 1% FeCl2 was made for the CV experiment to determine the redox potentials of Fe2+/Fe3+ in the 1.2 M of LiPF6 in the EC-EMC (3:7) electrolyte. In this portion of the experiment, Pt was used as the working electrode and the counter electrode, and Li was used as the reference electrode. The potential window was set from −0.4 V to 5.0 V with a scan rate of 20 mV/s as described above. Another CV experiment was carried out from 1.8 V to 4.3 V with a scan rate of 2.0 mV/s.
Characterization of the failed cells
After overcharge, the failed cells were transferred into the argon-filled box and were carefully disassembled to determine the cause of failure. The anode and the corresponding cathode and separator were cut for SEM and EDX (JEOL JXA-8900R) examination. Morphology, microstructure, and elements of the chosen anode, cathode and separator were analyzed using SEM and EDX.
In-situ high-energy synchrotron X-ray diffraction (HESXRD) investigation of the behavior of A123 18650 LiFeO4 cells during the 110% overcharge process
The high-energy synchrotron beamline of the Advanced Photon Source 11-ID-C (Argonne National Laboratory, IL) with a fixed high-energy X-ray beam (λ = 0.10798 Å, E = 115 keV, a beam size of 0.2 mm × 0.2 mm) was used to in-situ monitor the crystalline phase changes of A123 18650 LiFeO4 cells during overcharge-discharge cycles. An A123 18650 LiFeO4 cell was placed in the beamline and was cycled using a Maccor battery test system (Tulsa, OK) with the same overcharge-discharge protocol mentioned before, while two dimensional (2D) diffraction patterns of the corresponding crystalline phases of each component in the cell (i.e. graphite, LiFePO4, and stainless steel case) were recorded simultaneously during cycling. Data collection rate is one pattern per 30 seconds. The 2D data has been integrated to yield the one-dimensional high-energy synchrotron XRD (1D- HESXRD) patterns by FIT2D software.14 The peak intensities were normalized to the monitor counts of the X-ray beam. Only the 1D-HESXRD data of the last cycle right before failure is shown in this paper.
Results and Discussion
Behavior of A123 18650 LiFePO4 cell in the overcharge process
A systematic approach was taken to investigate the effects of overcharge with different SOCs on the cycle performance of A123 18650 cells. The results are shown in Figure 1. Using a normal cycle, where a cell is charged to 100% SOC, the cycle life for the A123 18650 LiFePO4 cell reached over 1950 cycles with 80% capacity (typical criteria for EV application) and 2600 cycles with 60% capacity (Fig. 1a); however, the overcharge process had a significant impact on cycle performance. When the cells were charged to 105%, 110%, 115%, and 120% SOC, the cells failed after 100 cycles, 11 cycles, 5 cycles, and 3 cycles, respectively, as shown in Figure 1b. A great impact can be seen after a 10% overcharge (the cycle life dropped to 11 cycles when the 10% overcharge was applied). It was found that the failure phenomenon in the overcharge process showed a consistent similar trend for different SOCs. In this paper, a typical overcharge process, 110% SOC (10% overcharge), was chosen for a detailed analysis to elucidate the failure mechanism through a fundamental understanding of the relationship between the performance, temperature, and microstructure changes of the A123 18650 cell in the overcharge failure process.

Figure 1. (a) Capacity & capacity retention vs. time in the normal cycle of an A123 18650 LiFePO4 cell (1130 mAh) at a 1C rate, (b) The effect of different SOC in the overcharge process on the cycle performance of an A123 18650 LiFePO4 cell.
The cell charge and discharge voltage and temperature during the cycle are shown in Figures 2a and 2b. The temperature at the end of the overcharge process increased with the cycle number and reached the maximum value right before the failure, while the cell voltage at the end of the overcharge process showed the same behavior but to a much less extent (Figs. 2a and 2b). The correlation of the changes of cell skin temperature and voltage with cycle number suggest that an internal shorting of the cell was developing with overcharging, which eventually led to the failure. Taking a close look at the temperature curve of each cycle (in the 10th cycle shown in Fig. 2c), the cell-skin temperature slowly increased with time but began a sharp increase at the end of the charge, indicating that the overcharge caused detrimental damage to the cell components. The same pattern repeated with cycle number for each cycle, and the temperature continued to increase until failure. The temperature increased with charging, then reached the highest temperature at the end of the overcharge process (33°C at 5.28 V, peak 1), then decreased with discharging; however, after the discharge plateau, the temperature increased again to another peak at the end of the discharge (26°C at 2.8 V peak 2). As for the temperature at peak 1, the temperature increased with the cycle number at a rate of 1.36°C/cycle, reaching 45.8°C when the battery failed. It was also noted that in the last five cycles, the temperature increased with a much higher rate, 2.54°C/cycle than that of the first five cycles (only 0.02°C/cycle). Compared with the temperature change at peak 1, the temperature change at peak 2 was very stable with a negligible rate, 0.15°C/cycle. Figure 2d shows the cell's discharge capacity and capacity decay with cycles of overcharge and discharge. The data for cell temperature at peak 1 are also included for comparison. It was found that there is a close relationship between the change of the temperature at peak 1 and the capacity of the cell. The capacity stayed stable in the first five cycles with a decay rate of 0.0008 Ah/cycle, and the corresponding temperature increase rate was 0.02°C/cycle, while in the last five cycles, the capacity decay rate raised up to 0.21 Ah/cycle and the corresponding temperature increase rate also went up to 2.54°C/cycle. It is well known that the abnormal operation of a Li-ion cell can result in the destruction and reformation of the anode SEI layer, especially at elevated temperatures.13 The high temperatures could lead to pressure buildup inside the cell, and consequently, the failure of the cell. Gas release from the cap of an A123 18650 cell was observed after it failed. Therefore, the behavior of the temperature, the voltage and the capacity of a cell can be attributed to the related reactions and the microstructure changes of the cell components inside the cell during the overcharge process.
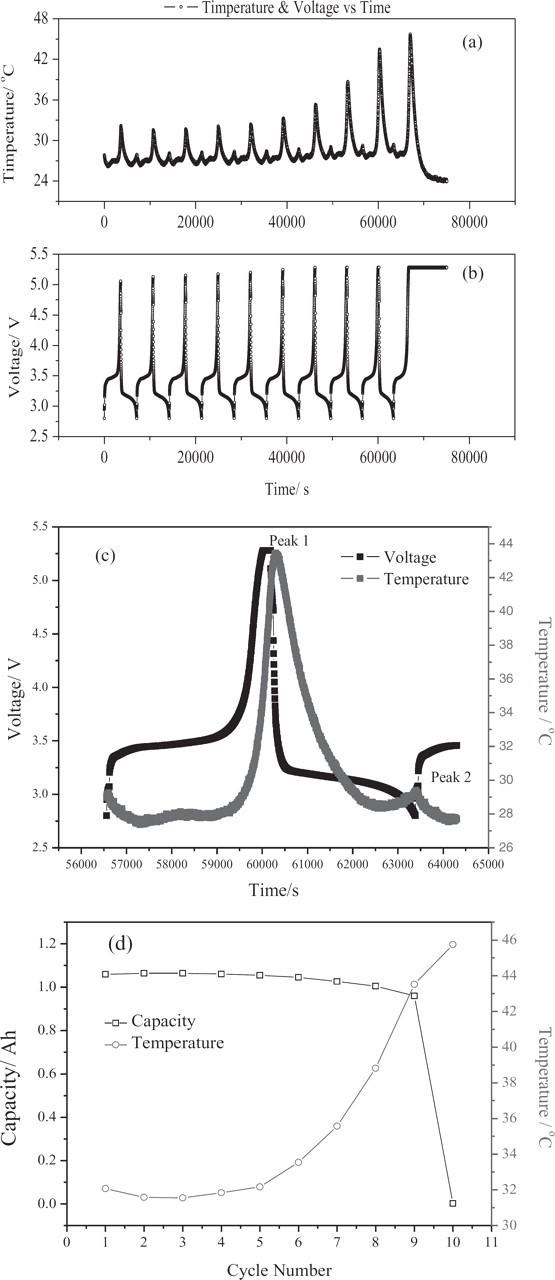
Figure 2. (a) Cell surface temperature, (b) cell voltage, (c) cell temperature and voltage of 10th cycle (right before failure) of 10% overcharge vs. time and (d) capacity vs. time in the overcharge test of an A123 18650 LiFePO4 cell (1130 mAh) at a 1C rate; charge and discharge conditions: 1.10 A (at 1C rate) overcharge to 5.28V, −1.10 A (at 1C rate) discharge to 2.80 V at room temperature.
In-situ monitoring of the potential of the anode and cathode and the cell voltage of LiFePO4 cells
In order to systematically study the failure mechanisms in the overcharge process, it is necessary to understand how the real potentials of the anode and cathode change during cycling. The head and bottom of the case of an A123 18650 LiFePO4 cell were carefully removed, and the core of the cell assembly (i.e. cathode, anode, and separator) was immerged into an electrolyte with a lithium reference electrode. In-situ monitoring of the anode and cathode potentials and the cell voltage of such a cell were measured for both normal cycling and overcharge cycling. The results are presented in Figure 3.
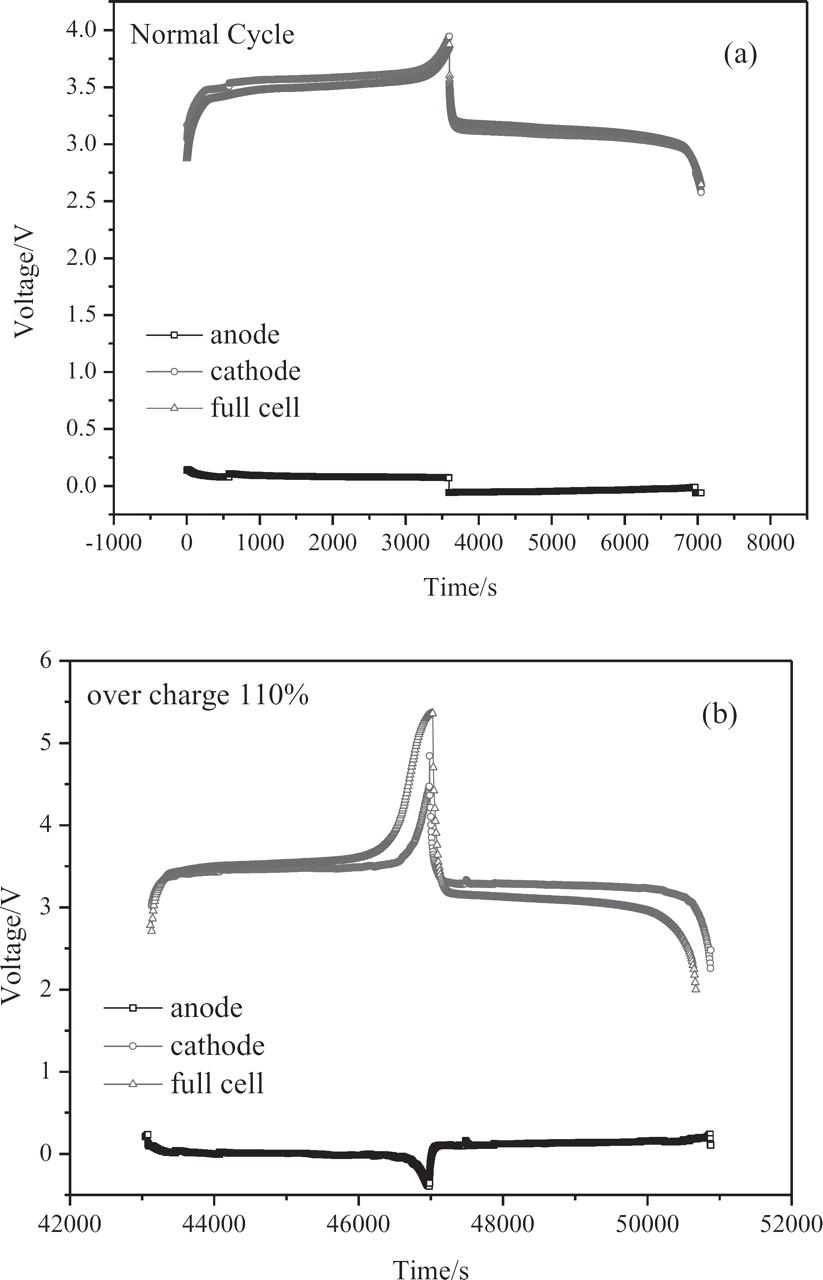
Figure 3. Potential variation of anode and cathode, and cell voltages vs. time during a normal cycle and overcharge-normal discharge cycle (at 1C) of a three-electrode A123 18650 LiFePO4 cell (1130 mAh) with a Li strip as the reference electrode; (a) normal cycle charge and discharge conditions: 1.10A (at 1C rate) charge to 4.60V, −1.10A (at 1C rate) discharge to 2.80 V at room temperature; (b) 10% overcharge. Charge and discharge conditions: 1.10 A (at 1C rate) overcharge to 5.28 V.
The potentials of the anode and cathode and the cell voltage of the whole cell vs. time in a normal cycle are presented in Fig. 3a. The potential of the anode started to decrease from 0.10 V at the beginning of the charge and reached −0.05 V at the end of the charge, corresponding to the intercalation of the Li ions into graphite; meanwhile, the potential of the cathode started to increase from 2.57 V (at the beginning of the charge) to 3.90 V (at the end of the charge,) corresponding to the de-intercalation of the Li ions from the LiFePO4 cathode. Typical curves of potentials of the anode and cathode and the cell voltage of the whole cell vs. time in a 10% overcharge (110% SOC) process are presented in Fig. 3b. The potentials of the anode and cathode as well as the cell voltage changed in the same pattern as under a normal cycle; but by the end of the overcharge process, the anode potential shifted more negatively, to −0.32 V, while the cathode potential shifted more positively, to 4.93 V. At the end of the overcharge process, the negative shift of the anode potential from −0.05 V (normal charge) to −0.32 V (10% overcharge) suggests that some reduction reactions may take place on the anode, while the positive shift of the cathode potential from 3.90 V (normal charge) to 4.93 V indicates that some oxidation reactions may occur at the cathode.
Electrochemical characterization of the iron corrosion process during the overcharge process
Metal, like Fe, has been considered to be one of the most important causes of the failure of LiFePO4 cells in the overcharge process6 because metals may be oxidized at a cathode and reduced at an anode to form dendrites during the charging and discharging processes, respectively, in a cycle, causing an internal short. CV experiments were designed to determine the oxidation/reduction potentials of Fe/Fe2+ and Fe2+/Fe3+ couples in the LiPF6/EC-EMC electrolyte system to see if the oxidation and reduction could occur during the overcharge process.
To obtain the redox potentials of Fe in the LiPF6/EC-EMC electrolyte system, a systematic approach was taken. The potential window of the LiPF6/EC-EMC electrolyte system was determined using a Pt working electrode first, to exclude any redox peaks from the electrolyte system; then, a Fe working electrode was used to observe the oxidation and reduction potentials of Fe in the electrolytes. Finally, Fe2+ ions were added into the LiPF6/EC-EMC electrolyte system to identify the Fe redox peaks (using Pt electrode) that appeared in the Fe electrode in the LiPF6/EC-EMC electrolyte system. The CV curves obtained from different types of working electrodes are (1) Pt, (2) pure Fe wire in the LiPF6/EC-EMC electrolyte system, and (3) Pt in the Fe2+ LiPF6/EC-EMC electrolyte system and are shown in Figures 4a to 4d, respectively. An overall comparison of CV curves is shown in Figure 4e. The baseline CV was obtained by using Pt as the working electrode in the LiPF6/EC-EMC electrolyte, shown in Figure 4a. Clearly, the baseline CV curve shows that no obvious redox peaks appeared in the entire potential range from −0.50 V to 5.00 V, indicating that the LiPF6/EC-EMC electrolyte system is electrochemically stable within this potential window. However, when Fe wire was used as the working electrode, as shown in Figure 4b, in the LiPF6/EC-EMC electrolyte system, there was one obvious pair of oxidation/reduction peaks at 2.70 V/2.30 V, which is consistent with that of the Fe2+ system (Figure 4c). Comparing Figs. 4a and 4c, it is easily identified that the reduction potential of Fe2+ ions is around 2.30 V, while the reduction potential of Fe3+ ions is around 3.20 V. However, the oxidation peak area was not as big as the reduction peak area, and the oxidation potential was not near 2.70 V, which raised a doubt as to whether there is a reversible couple for Fe/Fe2+ on 2.30 V/2.70 V. To further study if Fe2+ ions experienced a reversible reduction and oxidation in the system, a very slow scan rate (2.0 mV/s) was used from 1.60 V to 4.50 V (Fig. 4d). It is clearly evidenced that there are two oxidation/reduction pairs at 2.30 V/2.70 V and 3.20 V/3.50 V. In addition, the dark-colored deposit was found on the surface of the Fe electrode (Fig. 4f). From Figs. 4c, 4d, and 4f, it can be concluded that the Fe metal oxidized to become Fe2+ at 2.70 V (Fe → Fe2+ + 2e−); then, the Fe2+ further oxidized to become Fe3+ at 3.50 V (Fe2+ → Fe3+ + 1e−); when the potential scanned back negatively, Fe3+ reduced to Fe2+ at 3.20 V (Fe3+ + 1e− → Fe2+), then it further reduced to Fe metal at 2.30 V (Fe2+ + 2e− → Fe3+). During the experiment, it was observed that metallic Fe was plated out on the surface of the Fe metal electrode after the CV test (shown in Fig. 4f), confirming that Fe metal was formed during this CV scan process. The detailed Fe/Fe2+ and Fe2+/Fe3+ oxidation/reduction processes in the LiPF6/EC-EMC electrolyte system during the overcharge and discharge processes can be proposed based on the Fe/Fe2+, Fe2+/Fe3+ 15 oxidation/reduction potentials, as shown in Fig. 5. The possible iron reduction/oxidation reactions in the electrolyte are listed below:
Figure 4. (a) Cyclic voltammograms (CV) of Pt in a LiFP6 electrolyte (1.2 M LiPF6 in EC-EMC (3:7)), working and counter electrodes: Pt; reference electrode: Li strip, potential range: −0.50 V to 5.00 V (vs. Li/Li+), scan rate: 20 mV·s−1; (b) CV of Fe in LiFP6 electrolyte, WE: Fe, CE: Pt, and RE: Li, potential range: −0.50 V to 5.00 V (vs. Li/Li+), scan rate: 20 mV·s−1. (c) CV of Fe in 1.2 M LiFP6 electrolyte with 1% Fe2+, WE and CE: Pt, RE: Li metal, potential range: −0.50 V to 5.00 V (vs. Li/Li+), scan rate: 20 mV·s−1. (d) CV of Fe in 1.2 M LiFP6 electrolyte with 1% Fe2+, WE and CE: Pt, RE: Li metal, potential range: 1.80 V to 4.30 V (vs. Li/Li+), scan rate: 2 mV·s−1. (e) CV of different metals in LiFP6 electrolyte (LiPF6 in EC-EMC (3:7)); (f) photo of Fe working electrode, Pt counter electrode, and Li reference electrode after CV test.
Figure 5. Schematic representation of electrode potential of anode and cathode change of an A123 18650 LiFePO4 cell during each process: anode and cathode potential change (a) during the charging process and (b) during the discharging process of normal charge/discharge cycle. Anode and cathode potential change (c) during the overcharging process and (d) during normal discharge process of a cycle of the 10% overcharge and normal discharging cycle, with the reduction potential and redox scale for Fe/Fe2+/Fe3+ compared to pure Li metal in a LiPF6/EC/EMC electrolyte.
In the charging process of a normal charge/discharge cycle, as seen in Fig. 5a, the cathode potential increased from 3.00 V to 3.90 V (also seen in Fig. 3a); in this process, for iron, the only reaction possibly occurring on the cathode is the oxidation reaction 1 of Fe2+ to Fe3+. In the following discharge process (Fig. 5b), the cathode potential decreased from 3.90 V to 2.57 V (also seen in Fig. 3a). Only reaction 2, the reduction of Fe3+ to Fe2+, can occur at the cathode, suggesting that the reduction of Fe2+ ions into Fe metal cannot occur at the cathode in the normal charge/discharge cycle because the formation of Fe metal from Fe2+ ion reduction requires the cathode potential to be at least equal or less than 2.30 V. However, in the 10% overcharge and normal discharge cycles, the situation is different. In the charge process of the 10% overcharge-discharge cycle, shown in Figure 5c, the cathode potential increased from 2.70 V to 4.93 V (also seen in Fig. 3b), and reactions 1 and 3 occurred, namely, metallic Fe was oxidized to Fe2+ at 2.70 V, then Fe2+ was further oxidized into Fe3+ at 3.70 V at the cathode. In the following discharge process, the cathode potential decreased from 4.93 V to 2.20 V, while reduction reactions 2 and 4 sequentially proceeded, suggesting that Fe3+ was reduced to Fe2+ at 3.25 V and Fe2+ was further reduced to Fe metal at 2.30 V. Compared with the discharge processes in normal cycles, reaction 4 could not take place at the cathode because the cathode potential reached only 2.57 V (Fig. 5b) and never reached 2.20 V (Figs. 5d and 3b). This demonstrated that under normal cycling conditions, no Fe dendrites should form at the cathode unless an Fe under-potential reduction occurs; hence, Fe dendrites should not be the root cause of the failure for LiFePO4 cells under normal cycling conditions, which explains why these LiFePO4 cells have an excellent cycle life, more than 1950 cycles with an 80% initial capacity (Fig. 1a). In summary, during the 10% overcharging process, the cathode potential increased from 2.57 V to 4.93 V, while the Fe metal on the cathode was oxidized to Fe2+ at 2.70 V (Fig. 5c) and continued to be oxidized to Fe3+ at 3.50 V (Fig. 5d). Then, when the cell switched back to the discharge cycle, the cathode potential decreased from 4.93 V to 2.20 V, while at the cathode, Fe3+ could be reduced to Fe2+ at 3.25 V first, then it was reduced from Fe2+ to metallic Fe at 2.30 V. These formed Fe3+ and Fe2+ ions on the cathode could possibly diffuse to the anode side, driven by the potential gradient between the anode and the cathode. These diffused Fe3+ and Fe2+ ions on the anode side were then reduced to metallic Fe on the anode. Thus, with overcharge cycling, the Fe dendrite will grow from both the anode side and the cathode side. Eventually, these dendrites will penetrate through the separator, causing an internal short (see detailed results and discussion later). Since the amount of metallic Fe is very small, these shortings should be micro-shortings as evidenced in Figs. 7 and 8.
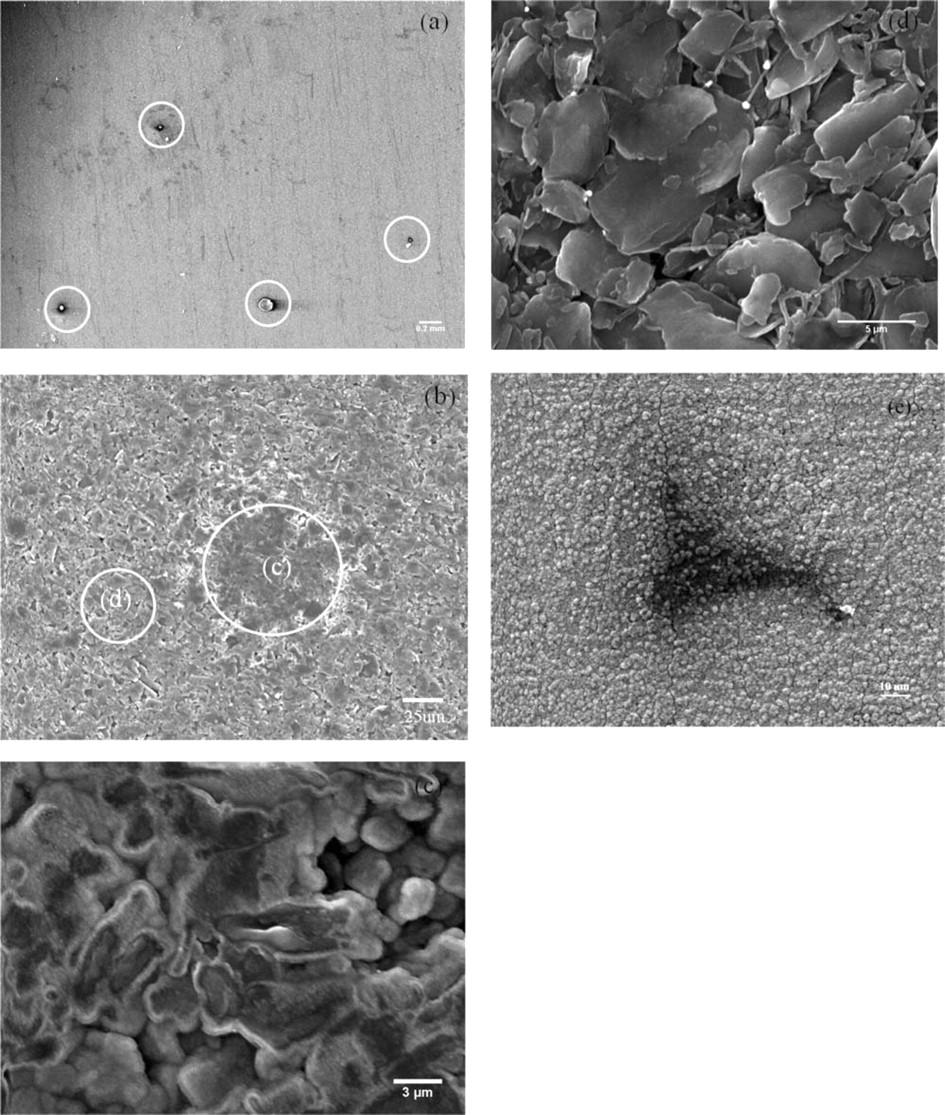
Figure 7. SEM of the anode and cathode surface of the failed A123 18650 LiFePO4 cell after the overcharging test. (a) Top-view of anode surface, (b) black spot on the anode surface, (c) high resolution image of black spot on the anode surface, (d) non-black spot on the anode surface, and (e) black spot on the cathode surface.
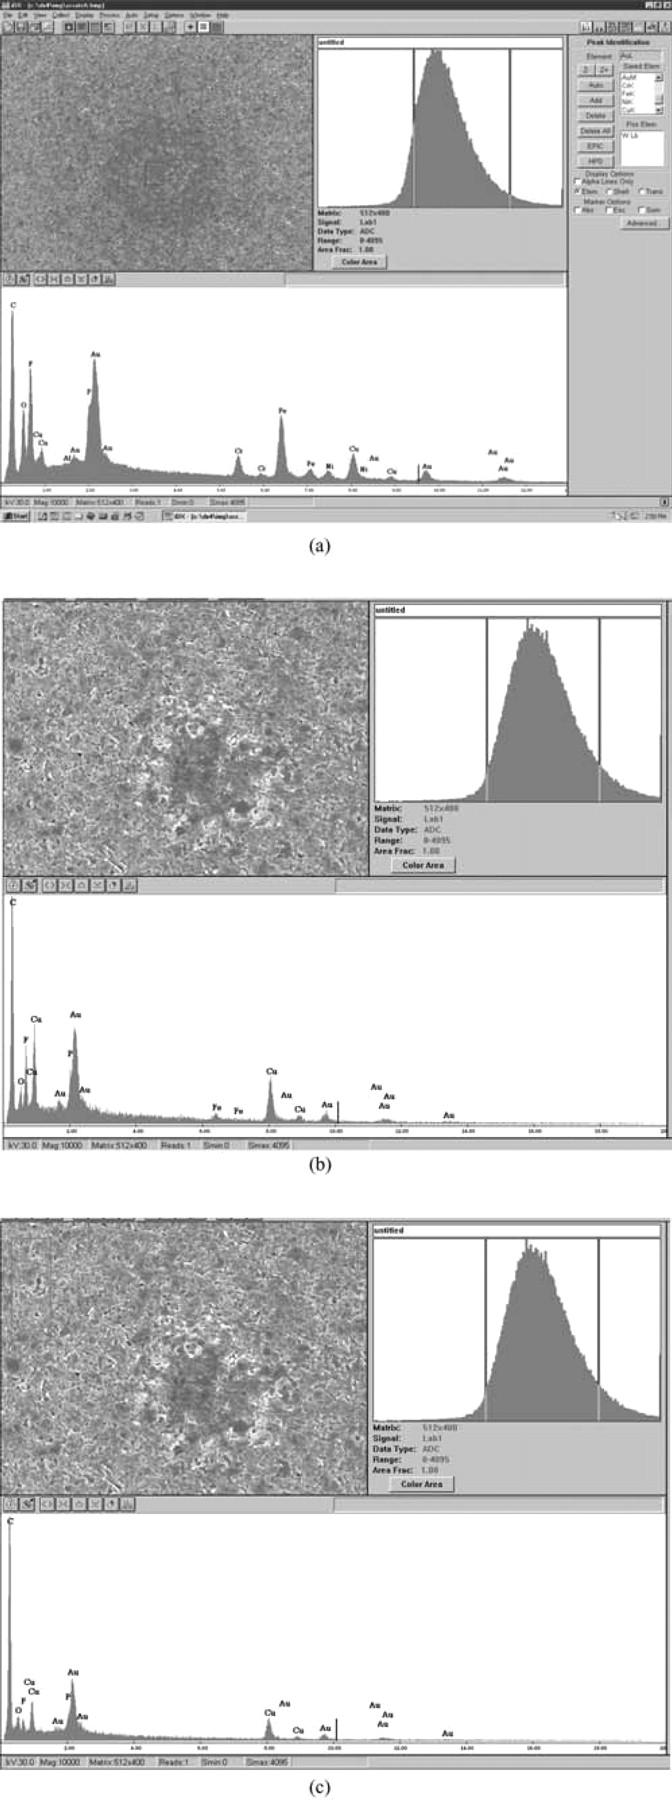
Figure 8. EDX of the anode surface of the failed A123 18650 LiFePO4 cell after the overcharging test, (a) center of the black spot, (b) side of the black spot, (c) non-black spot on the anode surface.
High-energy synchrotron X-ray diffraction (HESXRD) investigation
In order to further study the effects of the overcharge process on the failure of the cell, and, in particular, on the material failure, the HESXRD technique was used to monitor the crystalline phase change of the electrodes in the A123 18650 LiFeO4 cell during the overcharge-discharge cycle.
The 1D HESXRD patterns of the A123 18650 cell at different SOCs (10% SOC intervals) of the last overcharge-discharge cycle right before failure are shown in Figure 6. For this cycle, the diffractogram was recorded from the overcharge starting with 0% SOC. Once the SOC reached 110%, the discharging process was started. In the majority of the diffractograms, eight or more peaks were observed. The expected diffraction peaks (2θ) at 1.21°, 1.44°, 1.78°, 2.06°, and 2.47° were from the 200, 101, 111, 020, and 311 planes of the LiFePO4, the peak (2θ) at 1.25°, 2.53° was from the 200 and 121 planes of the FePO4. The signatures of the two-phase reactions of the LiFePO4/FePO4 are seen in Figure 6a for those peaks. In the overcharging process, the relative intensity of the peaks for LiFePO4 decreased with the increase of the SOC and disappeared at 110% SOC (Fig. 6a), whereas an opposite trend of relative intensity change of the peaks with SOC for the FePO4 was observed.16 Comparing the diffractograms of fresh cell data with this data (Fig. 6b), no obvious changes occurred for either the LiFePO4 or the FePO4 peaks, suggesting that there is no crystalline phase change, and the damage of the crystal structure of LiFePO4 and FePO4 is not the root cause of the failure. The same intensity of these peaks (fresh cell and cell before the failure) suggests that the LiFePO4 did not decompose.
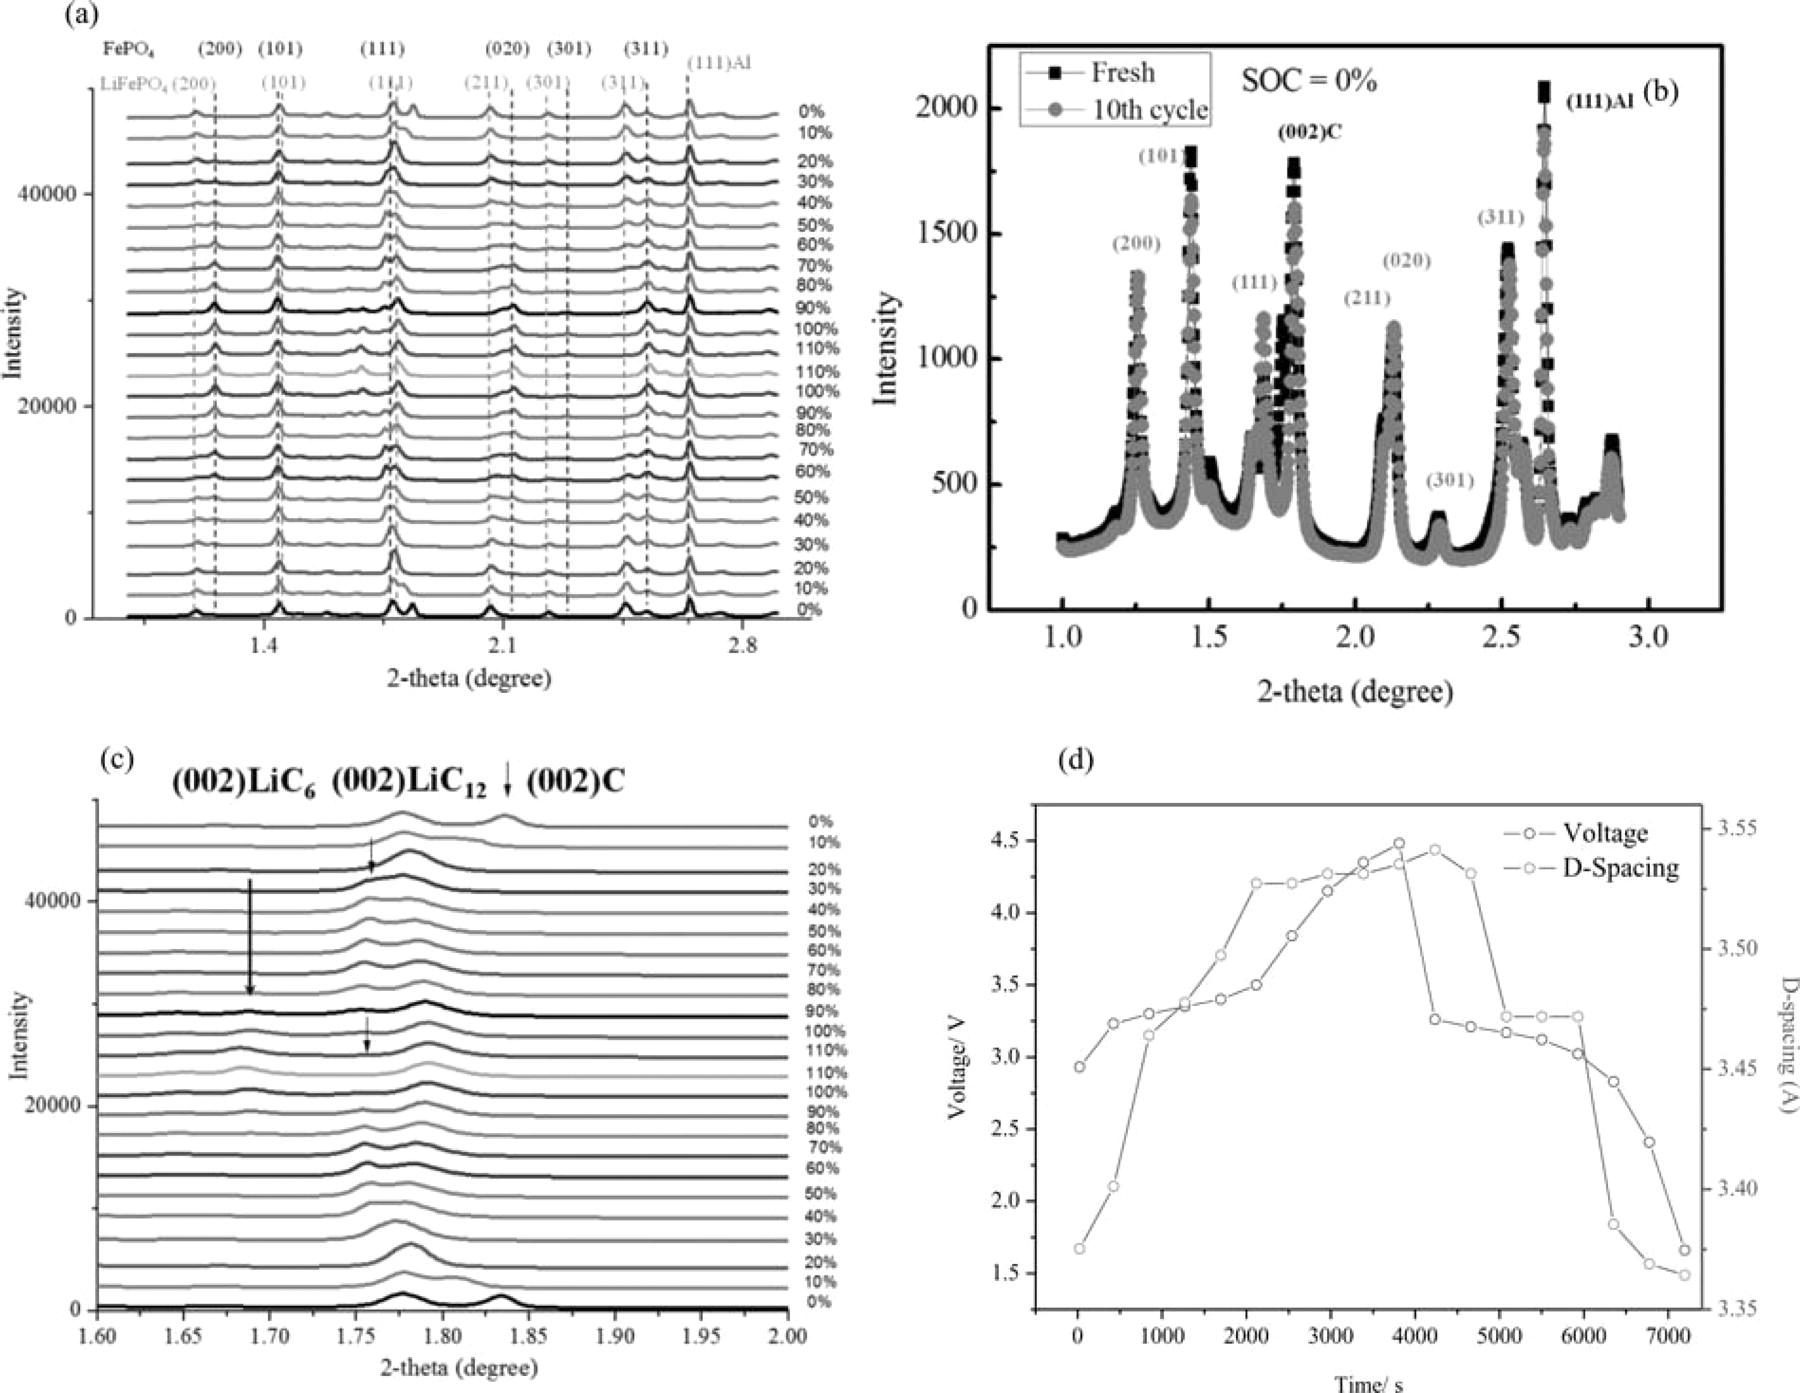
Figure 6. (a) Synchrotron XRD data of A123 18650 LiFePO4 cell in the 10th cycle (last cycle right before the failure of the cell) at different SOCs and DODs, (b) comparison of synchrotron XRD data of the fresh cell and the cell at 10th cycled at SOC = 0%, (c) graphite peak in the synchrotron XRD data of a LiFePO4 cell and (d) MCMB d-spacing changes of the anode in a LiFePO4 cell during the charge/discharge process.
The structural evolution at the anode side was simultaneously monitored together with that at the cathode side. The diffraction peak at 2θ = 1.84° (as the arrow shows in Fig. 6c), corresponding to the 002 plane of graphite, showed an interesting change during the overcharging-discharge cycle. The 002 plane peak of graphite shifted to smaller angle with increased SOCs (Fig. 6b); due to the Li+ ions insertion, then, after 30% SOC, the peak position remained approximately constant at 2θ = 1.76°, which is the (002) reflection position expected for the stage-2 LiC12, whereas the relative intensity of the peak decreased as the SOC increased. After 100% SOC, the peak for the graphite disappeared, while a new peak at 2θ = 1.67° appeared, which is the (002) reflection of the stage-1 LiC6. This process was reversed in the discharge process.
The distance between two neighboring graphite layers, d-spacing, can be calculated from the diffraction peak according to the Bragg Equation. The calculated d-spacing change over time during the overcharge and discharge cycle is shown in Fig. 6d along with the cell voltage change. Clearly, d-spacing increased with SOC during the overcharge process, corresponding to the insertion of Li+ ions into the graphite layers. The d-spacing decreased as the SOC decreased, indicating the de-insertion of Li+ ions out of the graphite layers. The typical d-spacing of the natural graphite for 0% SOC is 3.354 Å,17 and the change in the d-spacing of the graphite layer during the cycle was within 6% of the standard value. There is a sudden increase of the layer spacing of about 5% of the stage-1 LiC6 in comparison with that of the stage-2 LiC12. The significant change of d-spacing of the graphite layer may cause the collapse of the layer structure of the graphite, which in turn, will result in the increase of the Li+ ion diffusion barrier, and consequently, a decrease of Li+ ion diffusion coefficients within the graphite. Such a decrease of the diffusion coefficient may cause the increased internal resistance, and naturally, a higher temperature of the cell. Such a small change of d-spacing as that observed in Fig. 6d should not cause such a significant increase in cell temperature. Hence, the structural changes of the graphite anode are unlikely the root cause of the failure.
Physical characterization of the microstructure of the cells
To clearly understand the failure causes, the anode, cathode and separator of a failed cell were examined using SEM. As can be seen in Fig. 7a, a number of black spots with different radii (from ∼10 to 25 μm) were found randomly on the surface of the anode after the cell failed. With a higher magnification SEM image, Fig. 7b, it can be seen that there was a great difference in the color and morphology between the black spot (c) and the spot next to it (d). Clearly, the center of the graphite inside the black spot looks darker with a lava-looking feature, compared to the spot next to it. Higher resolution images inside the black spot (Fig. 7c) and the surrounding spot (Fig. 7d) reveal a significant surface feature change. It looks like the graphite flakes were burned or melted, resulting in the loss of their edges and the formation of a flat mesa (Fig. 7c) compared with that the surrounding spots in which complete edges of each graphite flake can be clearly seen (Fig. 7d). The black spots were also found on the surface of the cathode (Fig. 7e), which agrees with Jin et al.'s work on valence and BTR LiFePO4 cells.8 It was suggested in Jin et al.'s and Belov's work that these spots could be from soft micro-shorting caused by metal iron particles.8,11
To identify the chemical composition of the black spot, EDX was applied on different locations. Due to the very strong EDX peaks of Fe (Fig. 8a), it was found that at the anode, a small amount of Fe existed in the center of the black spot. In some black spots, not only Fe, but also Ni and Cr were found. This suggests a possibility that Fe may exist in the form of stainless steel on the center of the black spot. However, where the stainless steel comes from and how it comes into the electrode are still issues that are under debate. A detailed discussion of these issues is beyond the scope of this work. Across the boundary of the black spot (Fig. 8b), Fe also existed, but in a much smaller quantity shown by the relatively smaller intensities of Fe peaks than those in the center. Fe was not found in the surroundings outside the black spot (Fig. 8c). The EDX results of the anode are summarized in Table I. EDX was not carried out on the surface of the LiFePO4 cathode because it is difficult to differentiate the metallic Fe from Fe2+ reduction and the Fe from the LiFePO4. However, the same black spots were observed on the surface of the LiFePO4 cathode (Fig. 7e). Therefore, from the SEM and EDX observations, it can be concluded that Fe metal particles formed a bridge between the anode, through the separator, and to the cathode. This bridge could lead to micro-shorting due to the formation of the metal dendrites which can penetrate through the separator, and eventually could have caused the failure of the cell, which is consistent with Jin et al.'s8 and Belov's work.8,11
Table I. Elemental analysis from EDX for fresh anode, failed anode, and cathode connector.
CuNiCrFeC| Fresh Anode | √ | √ | |||
| Failed Anode | √ | √ | √ | √ | √ |
Sources of metallic Fe in A123 18650 cells
From the results of the 1D HESXRD, it can be concluded that the iron metal found in the black spot did not come from the decomposition of LiFePO4 during the overcharge process. It is also unlikely that the iron metal came from the dissolution of the stainless steel case because that cell case is connected to the anode side. The highest anode potential, reached during overcharge-discharge cycle, was only 0.20 V (vs. Li/Li+), which is much lower than the oxidation potentials of Fe, Ni, and Cr in the LiPF6/EC-EMC electrolyte.18 Thus, the anode potential, 0.20 V (vs. Li/Li+), makes the oxidation of the stainless steel in the LiPF6/EC-EMC electrolyte impossible. Consequently, the metallic Fe must not have come from the dissolution of the stainless steel case of the cell. The cathode side has also been carefully checked, and no stainless steel parts were connected to the cathode. There are other two possible sources for the metallic Fe: (1) the extremely fine powder of stainless steel in either the anode graphite or the cathode LiFePO4 powders, which may come from the stainless containers/vessels used in the fabrication and synthesis process of electrode materials and (2) the Fe segregated locally from LiFePO4 during the transformation of LiFePO4 to FePO4. In order to determine whether the metallic Fe was coming from the raw materials, the graphite and LiFePO4 powders were analyzed using XRD for both the pristine samples and the overcharged samples (Fig. 9). The theoretical metallic Fe XRD peak is about 2θ = 45°. The XRD results in Figs. 9a and 9b did not show any metallic Fe peaks. However, it still cannot rule out the possibility that the metallic Fe comes from the raw materials of the graphite and the LiFePO4. The expected metallic Fe existing in raw electrode materials should be in very small amounts, 1% or much less. The XRD used in this study has a resolution of only 5%, which may not be able to detect any metallic Fe. The determination of the origin of the Fe is a very interesting topic, not only for the fundamental study of the failure, but also for the improvement of the safety of the A123 18650 cells. Discussion with manufacturers of A123 18650 LiFePO4 cell revealed that many processes and steps involved in the synthesis of electrode materials, the fabrication of electrodes and the assembly of cells, which could possibly introduce trace amount of metallic Fe. Work is planned to use HESXRD, which has a 1% or 0.1% resolution due to its high-energy beam; the XAS is also planned to be used for determining the oxidation states of Fe in these raw materials. The results will be published in the future.
Figure 9. (a) The powder XRD pattern of lithium iron phosphate, LiFePO4 (a: fresh powder, b: after overcharge) along with the reference spectra of Fe metal; (b) the powder XRD pattern of MCMB (a: fresh powder, b: after overcharge) along with reference spectra of Fe metal.
Failure mechanism
After systematically studying the behavior of the A123 18650 LiFePO4 cells in overcharging conditions, and after characterizing these results by using SEM/EDX on the failed electrodes, in-situ monitoring of the potential changes and the structural changes of the anode and the cathode using HESXRD, and electrochemically determining the redox potentials of the Fe for different reactions in the LiPF6/EC-EMC electrolyte system, the possible failure mechanism of an A123 18650 LiFePO4 cell in the overcharge/discharge cycle can be proposed. In an A123 18650 LiFePO4 cell, the iron in its metallic form (possibly as particulates of stainless steel) on the cathode side was oxidized to Fe2+ ions at 2.70 V and continued to be oxidized to Fe3+ ions at 3.70 V in the overcharging process; then, Fe3+ was reduced to Fe2+ at 3.25 V and further reduced to Fe metal at 2.30 V in the discharging process, while some of the Fe2+ ions diffused to the anode side driven by the potential gradient between the anode and the cathode. The Fe2+ ions in the proximity of the anode can be reduced to Fe metal to form dendrites because the anode potential is in the range of −0.32–0.22 V, which is far less than the reduction potential (2.3 V) of Fe2+ + 2e− → Fe. The dendrites will keep growing from both the anode and the cathode with overcharge/discharge cycles, and eventually, the separator will be penetrated through to cause a micro internal short.
Again, please note that in the overcharge process, Fe2+ cations can be reduced not only on the graphite anode surface,8 but also at the cathode side during the discharge process. This could greatly increase the probability of micro-shorting. The Fe dendrites were formed more easily on the anode side due to the over-potential on the anode. That is the reason why, during the overcharge process, the cell failed after only 10 cycles. Furthermore, because the iron dendrite can be re-oxidized due to the higher potential on the cathode, more Fe dendrite/metal exists on the anode side rather than on the cathode side, which agrees with the results found by Richard Stringfellow et al.6
During normal cycle conditions, Fe2+ ions cannot be reduced to Fe metal (2.30 V) at the cathode because the cathode potential can decrease only to 2.57 V, which is much higher than 2.30 V. This is the reason why iron effects are the major cause of failure during the overcharge process rather than during the normal cycle.
Conclusions
The failure mechanism of commercial LiFePO4 cells was systematically investigated using commercial A123 18650 cells during overcharge/discharge cycling conditions at a 1C rate and different overcharge processes. A typical overcharge process, 10% overcharge (110% SOC), was chosen for detailed analysis. It was found that there was a close relationship between the cell surface temperature and capacity during the overcharge process. The anode and cathode potentials and the cell voltage were monitored using the cell assembly from an A123 18650 LiFePO4 cell with a Li metal strip as the reference electrode in the 10% overcharge-discharge cycle. It has been shown that the cell failed quickly after 10 cycles with an increasing surface temperature. During the normal cycle, in the charging process, the anode potential decreased from 0.10 V to −0.05 V while the cathode potential increased from 2.57 V to 3.90 V, while in the 10% overcharge process, the anode potential decreased from 0.22 V to −0.32 V and the cathode potential increased from 2.20 V to 4.93 V. The potential of the Fe/Fe2+ oxidation/reduction pair was found to be at 2.30 V and 2.70 V in a half cell cyclic voltammogram experiment. HESXRD was used to investigate the microstructure changes of the electrodes during the overcharge and the followed discharge process. It was concluded that the iron, which could form dendrites, was not from the decomposition of the LiFePO4. From the SEM and EDX results, it was found that black spots appeared in the anode, cathode, and separator. Fe, Ni, and Cr were found only in the black spots on the anode side, indicating the formation of an iron bridge between the anode and the cathode; consequently, microshorting is the major cause of the failure of the A123 18650 LiFePO4 cells during 10% overcharge cycling conditions. Combining all results, the proposed possible failure mechanism is that the iron is oxidized into Fe cations on the cathode side during overcharge and is then reduced on both the cathode (during discharge) and the anode (during charge) to form Fe dendrites and, eventually, it will form the iron bridge that causes the microshorting. This more easily occurs in overcharge conditions than in the normal charging conditions due to the cathode potential changes.
Acknowledgments
- © Copyright 2021 IOP Publishing
- Terms & conditions
- Disclaimer
- Privacy & cookie policy This link opens in a new tab.
- This site uses cookies. By continuing to use this site you agree to our use of cookies.