Coronavirus — It’s not slowing down, so we need to take action now.
A statistical approach to understand where we’re heading
Tuesday 10 March 2020 - 12.30pm (GMT+1)
Everyday the WHO publishes a daily situation report on the Coronavirus spread, providing the details of each country for the day. This can be found here.
While the data is presented in raw form, we have to structure it in a way to turn data to information which we can use to understand and learn better what is happening.
A simple exercise shows that the situation is very dire. If we take Italy as a benchmark, and compare their trajectory to infected numbers to other countries, it is very evident that other countries are doing better to slow it down, but are nowhere near enough to avoid the numbers in Italy. What is happening in other countries, such as Germany and France, is that it’s taking a bit longer to get to the numbers in Italy, but as of today there is the decrease in acceleration is only 30–35%. This means it will simply take a bit longer for these countries to reach the Italian equivalent in terms of numbers.
Here’s the data:
Germany:
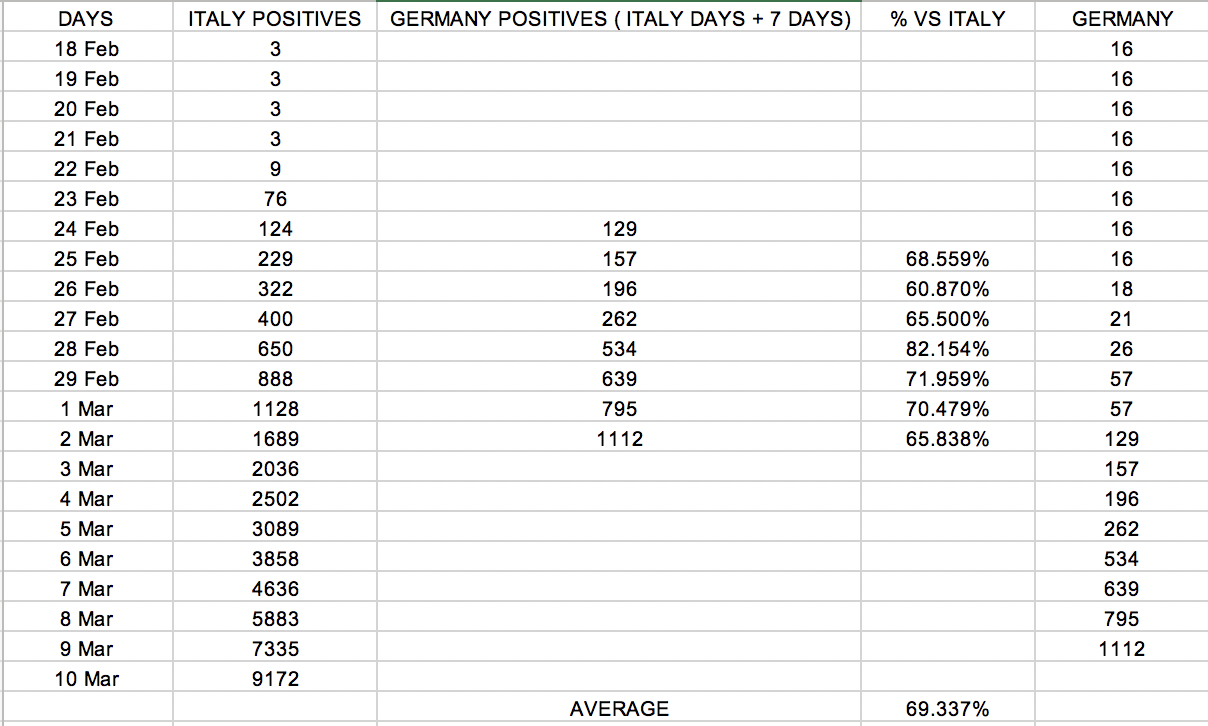
As we can see from this table, if you take the total number of positives in Germany on the 2 March (129) and compare to the almost equivalent number in Italy on 24 February (124), we can compare the trajectories in a head to head fashion.
The result is a situation where Germany’s duplication rate is indeed slower, at over 69% of the Italian one. However this is still extremely high. Unless that figure goes down in the next few days, what we will see is an exact replica of what has happened in Italy, only a few days later.
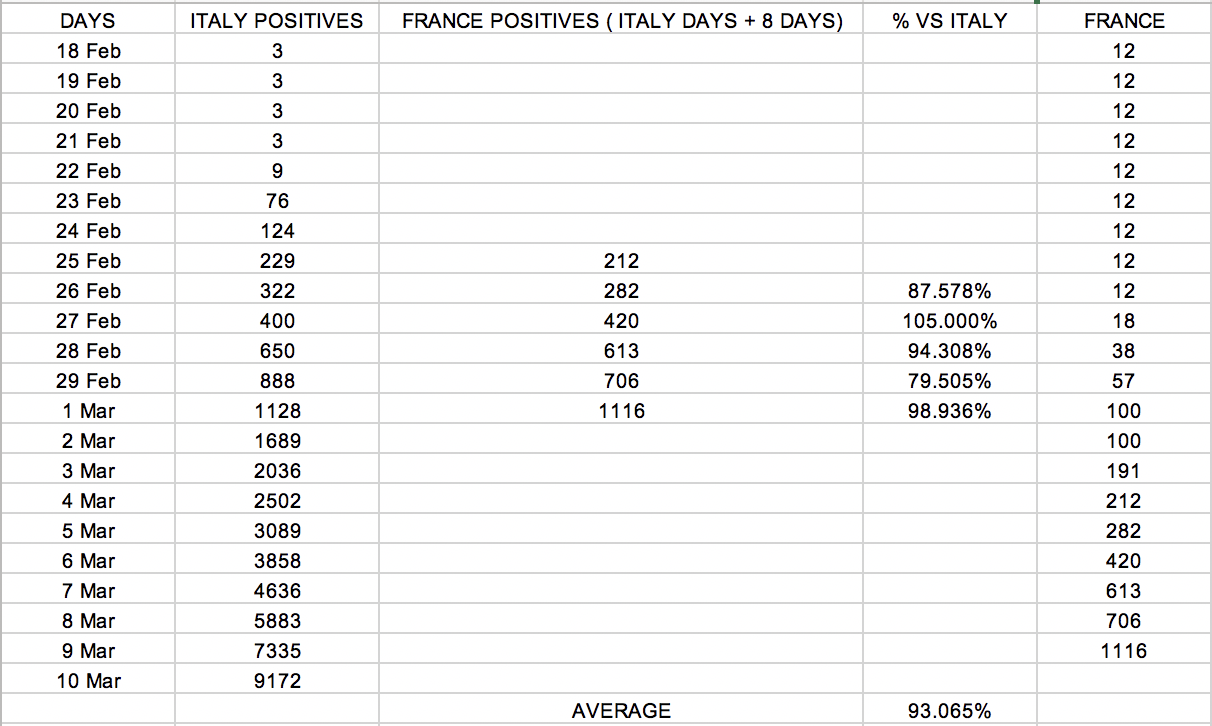
France
The situation in France is remarkably worse, and is almost in line with the accelerations in Italy, at over 93%. France is, statistically, almost literally in the position that Italy was eight days ago.
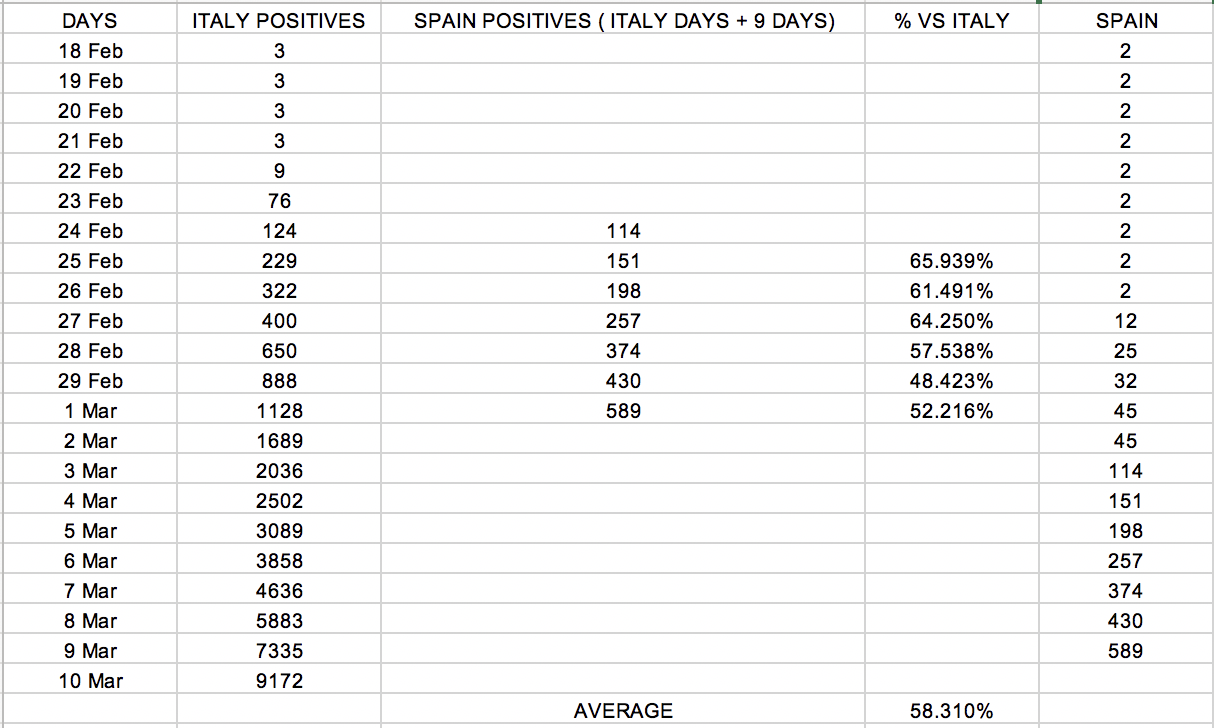
The situation in Spain (among the best performers, yet still relatively high at 58%):
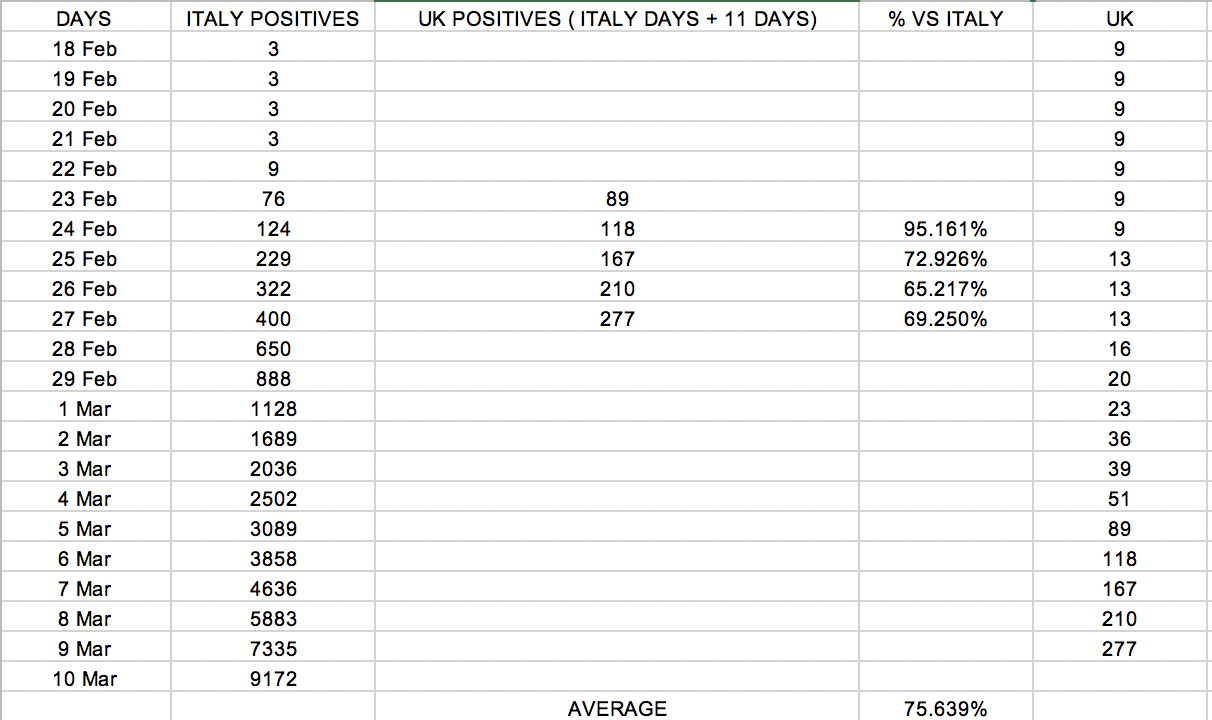
The UK:
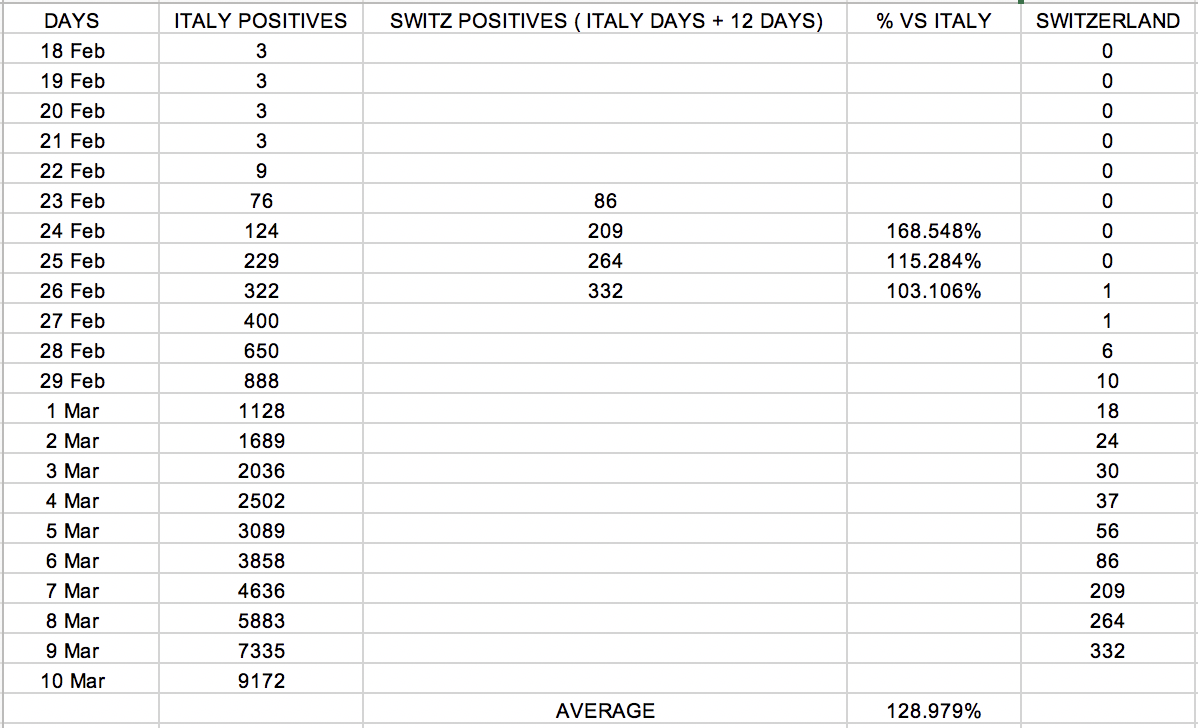
Switzerland:
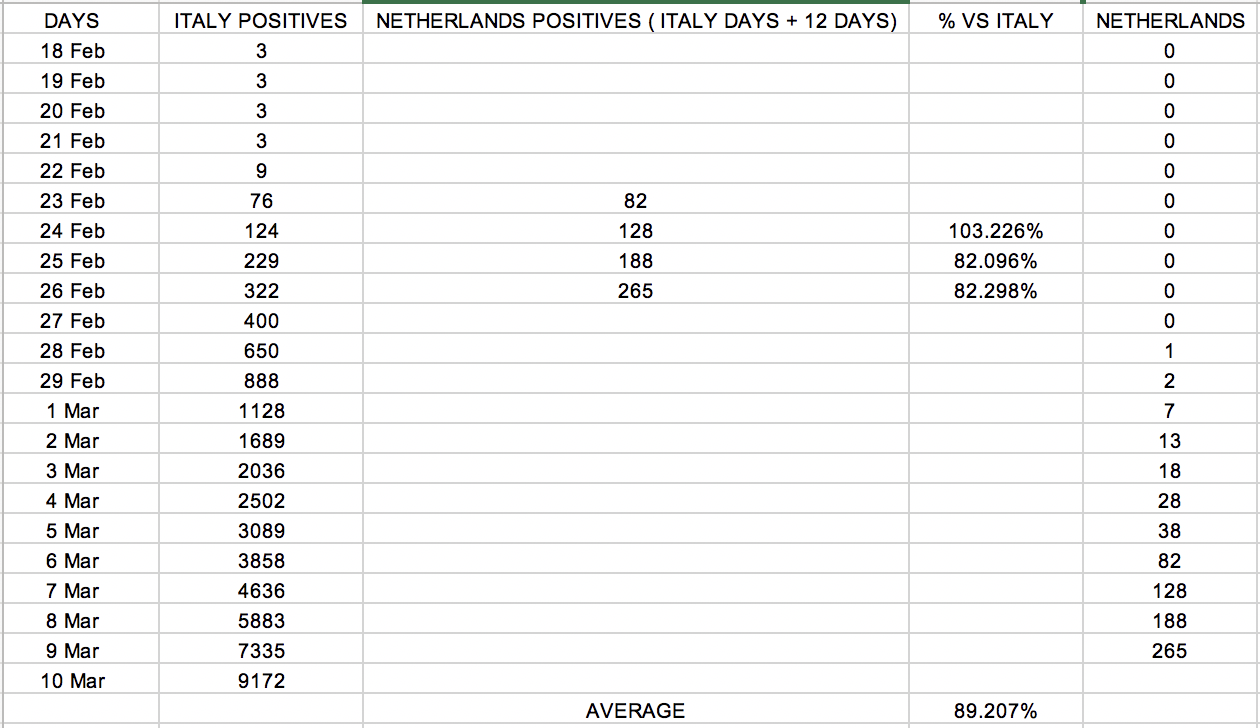
Netherlands:
Why not USA?
As you can see from the above, I’ve listed a number of countries but not the US. This is because data there, at least the one provided to the WHO, is very unreliable for a myriad of reasons, including the fact that the test:positive ratio indicates that much more tests need to take place to have any sort of reliable data on the real situation.
What can we learn from this data?
Unless those percentages tank over the next day or two, we need to consider a situation where Europe is besieged by numbers in the same way that Italy has. Governments should not wait for the numbers to triple and quadruple to take extreme action, when the evidence above clearly shows the aggressiveness of the Coronavirus is in many cases very strong, in others at par with Italy.
Around a week and a half ago Italy locked down a number of towns in the North, and the wisdom of that decision is bearing fruit only today. These towns are reporting today that numbers have fallen.
Let’s take action based on what the evidence is showing us. Never before today has the internet played a role to pressure people to follow the evidence, rather than react on what is in front of them.
Let’s not wait until it’s too late. We must learn from the data, plot the trend and prepare and action on what is obviously coming our way by taking extreme measures today.
---
Data: WHO